Recommended resources
The freely available resources this lesson will direct you to.
Introduction
Welcome back! In the last few lessons, we've taken a deep dive into your analytics. You've learned how to identify your best-performing content (what to post) and the optimal times to publish it (when to post). These are powerful skills for refining your day-to-day tactics.
Today, we're going to zoom out and look at the big picture. This lesson is about answering a critical question for any creator managing multiple accounts: Which of my social media platforms is driving the most growth?
Knowing this helps you decide where to invest your most valuable asset: your time. By the end of this 60-minute lesson, you will be able to use your tracking data to calculate the growth rate for each of your platforms and confidently identify which one is currently giving you the best return on your effort.
Why Follower Growth Rate is the Key Metric
When comparing platforms, it's tempting to just look at the raw number of new followers. For example, gaining 100 followers on Instagram and 100 followers on TikTok might seem like equal success. However, context is everything.
- If your Instagram account grew from 1,000 to 1,100 followers, that's a 10% increase.
- If your TikTok account grew from 100 to 200 followers, that's a 100% increase.
The follower growth rate shows you the momentum of your account relative to its size. The TikTok account, while smaller, is growing ten times faster. This percentage tells a much more accurate story about which platform's strategy is currently most effective at attracting a new audience.
Calculating Your Follower Growth Rate
The formula for calculating this is straightforward. For a specific period (like a month), you take the number of new followers, divide it by the number of followers you started with, and multiply by 100 to get a percentage.
To get a solid grasp of this concept and the steps involved in the analysis, let's turn to a practical guide.
Social Media Follower Growth Rate Analysis
This resource from Umbrex provides a clear, step-by-step breakdown of how to conduct a follower growth rate analysis. It will walk you through the data you need, the calculation, and how to start analyzing the results.
Please read the sections 'Data required' and 'Detailed step-by-step instruction on how to conduct the analysis'. Focus on the 3-step process: Collect Data, Calculate Growth Rate, and Analyze Correlation. You'll be applying these steps yourself shortly.
Action Step: Analyze Your Own Growth
Now it's time to apply this to your own accounts. You will use the tracking spreadsheet you created in a previous lesson.
1. Gather Your Data
Open your social media tracking spreadsheet. For the last 30-day period, you'll need two numbers for each platform (Instagram, TikTok, YouTube, X, Pinterest):
- Starting Followers: Your follower count 30 days ago.
- Ending Followers: Your follower count today.
If you don't have historical data in your spreadsheet yet, you can find the current follower count easily on your profile. For the starting number, some platforms provide this in their analytics. Here's a quick guide based on what we've covered before:
- Instagram: Go to
Professional Dashboard>Total Followers. The graph at the top shows your follower count over the last 30 days. You can tap and hold on the graph to see the number on a specific date. - TikTok: Go to
Creator tools>Analytics>Followerstab. The graph shows follower changes, allowing you to identify your starting and ending numbers. - YouTube: Go to
YouTube Studio>Analytics. Your subscriber count is prominently displayed, and the main graph shows its change over the last 28 days. - X (Twitter): Go to
analytics.twitter.com. The homepage dashboard shows your follower count and the net change over the last 28 days. - Pinterest: Go to your business profile >
Analytics>Overview. You can set the date range to the last 30 days and see your follower change.
2. Update Your Spreadsheet
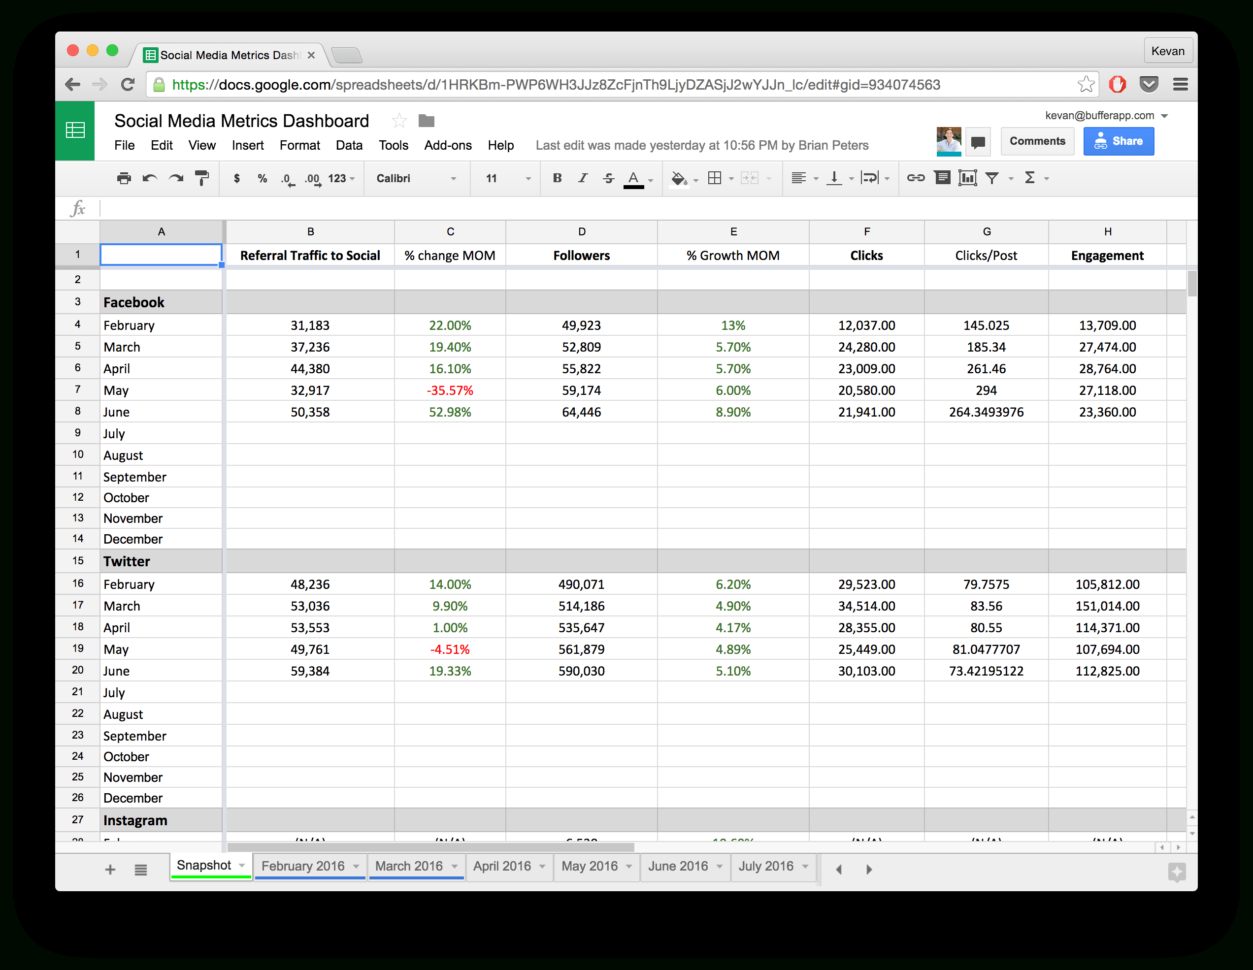
Add three new columns to your spreadsheet for each platform: Start Followers, End Followers, and Growth Rate (%). Populate the first two columns with the data you just collected.
3. Calculate the Growth Rate
In the Growth Rate (%) column, use the formula to calculate the rate for each platform. If you're using Google Sheets or Excel, you can enter the formula directly. For example, if your Start Followers are in cell B2 and End Followers are in cell C2, the formula would be =((C2-B2)/B2) * 100.
Your spreadsheet should now look something like this, allowing for easy comparison.
Interpreting Your Results: What Do the Numbers Mean?
You now have a clear, data-backed comparison of your platforms.
- The Highest Growth Rate: This platform is your current growth engine. Your strategy here—the type of content, your posting frequency, your engagement tactics—is resonating most effectively with new people.
- Low or Negative Growth Rate: This indicates an area for improvement. The content might not be hitting the mark, or perhaps you haven't been as active on that platform.
To go deeper, let's explore how to analyze the why behind your growth numbers.
How to Calculate Follower Growth On Social Media: A Full Guide
This guide from Socialinsider gives excellent, practical methods for analyzing your follower growth. It moves beyond just the numbers and helps you connect them to your specific actions.
Read the section 'How to analyze follower growth'. Pay close attention to the subsections 'Check what caused spikes or flat growth' and 'Evaluate growth by content type'. This will help you link your growth data back to the content analysis you did in a previous lesson.
Your Analysis Action Step:
Look at your results and ask yourself these questions for your top-growing platform:
- What did I do differently here? Did I post more consistently? Did I use a new format (e.g., more Reels on Instagram, longer videos on YouTube)?
- Did a specific post go viral? Look at your best-performing content from the last month. Did one post bring in a huge wave of new followers?
- How can I replicate this success? Can you create more content similar to what worked? Can you apply the successful strategy to your other, slower-growing platforms?
Professional tools often visualize this data in a way that makes comparison instant. Your spreadsheet serves the same purpose.

Conclusion
Congratulations! You've moved from simply collecting data to performing a meaningful analysis that has a direct impact on your strategy. By identifying which platform is driving the most growth, you can make smarter decisions about where to focus your creative energy.
Key Takeaways:
- Growth Rate is King: Use the follower growth rate percentage, not just the raw number of new followers, to accurately compare momentum across platforms of different sizes.
- The Formula: The calculation is simple:
((End - Start) / Start) * 100. - Analyze the "Why": The most important step is to connect your growth data to your actions. Identify what content and strategies are working on your best platform so you can double down on them and test them elsewhere.
- Focus, Don't Abandon: A low growth rate on one platform doesn't necessarily mean you should abandon it. Instead, see it as an opportunity to apply the lessons from your successful platforms to improve your strategy there.
Preview of the Next Lesson:
You now have all the critical pieces of the puzzle: you know your best content, the best times to post it, and which platform is your biggest growth driver. In our next lesson, we will put all of this insight into action. You will create a revised weekly content schedule for the next month, building a data-driven plan designed to maximize your growth.