Recommended resources
The freely available resources this lesson will direct you to.
Introduction
Welcome back! In our last lesson, we defined the "Big Three" Key Performance Indicators (KPIs) that every creator needs to understand: Reach, Follower Growth, and Engagement Rate. We learned what these metrics are and why they are so crucial for signalling to social media algorithms that your content is valuable.
Now, it's time to move from theory to practice. Knowing what to track is only half the battle; you also need a system for actually doing it. This lesson is a hands-on workshop where we'll build that system. Our goal is to create a simple spreadsheet to track your weekly KPIs for each of your social media platforms. Think of this as building the command center for your future influencer career. From here, you'll be able to make smart, data-driven decisions instead of just guessing what works.
Why Start with a Spreadsheet?
Before diving into complex analytics software, the best way to understand your numbers is to track them manually. A simple spreadsheet (using a free tool like Google Sheets) is perfect for this.
- It's free and accessible.
- It forces you to engage with your data. By manually inputting the numbers each week, you'll build a much deeper, more intuitive understanding of your performance.
- It's completely customizable. You can track exactly what matters to you and your 'cheap and cheerful' niche, without the clutter of metrics that aren't relevant.
The process we'll follow is recommended by many social media experts as a foundational step.
How to Build Your Social Media Dashboard in 3 Steps
The team at Buffer, a popular social media management tool, explains how to build your own dashboard from scratch. This article highlights the first essential step: collecting your data in one place.
Read the section titled 'Step 1: Collect all the data you need'. Pay close attention to the recommendation to use Google Sheets to organize your data. Also, take note of the important point about analytics on X (formerly Twitter) requiring a premium subscription.
Designing Your Analytics Tracker
We are going to create a Google Sheet with a simple but powerful two-part structure:
- A "Weekly Snapshot" tab: This will be your high-level dashboard where you can see your most important KPIs at a glance.
- "Platform Deep Dive" tabs: A separate tab for each platform (Instagram, TikTok, etc.) where you will log the raw data each week.
This structure allows you to see top-level trends easily while also keeping your raw data organized. Here are a couple of examples of what a finished tracking spreadsheet can look like.
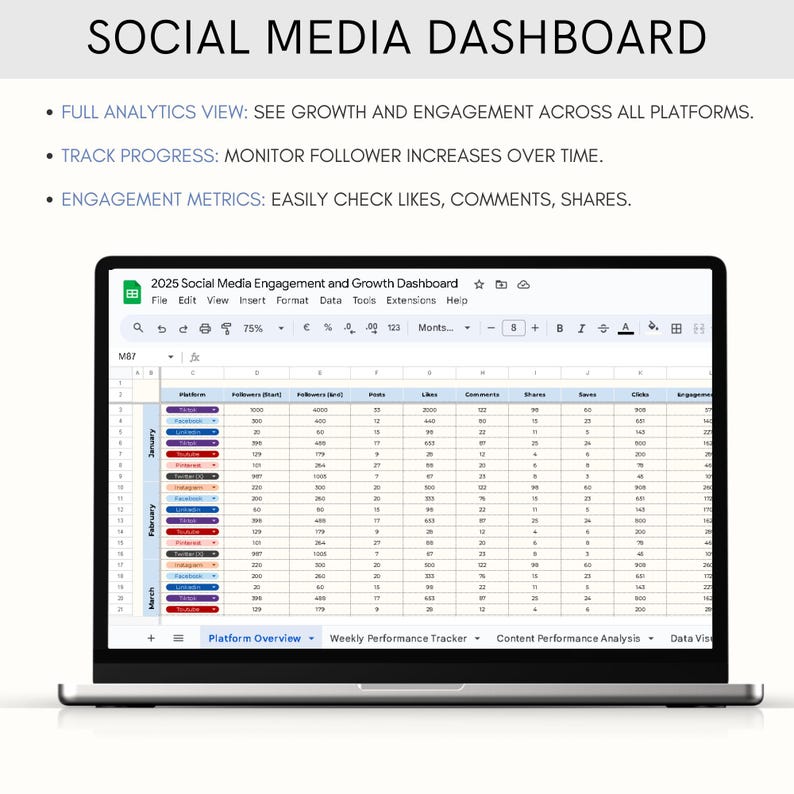
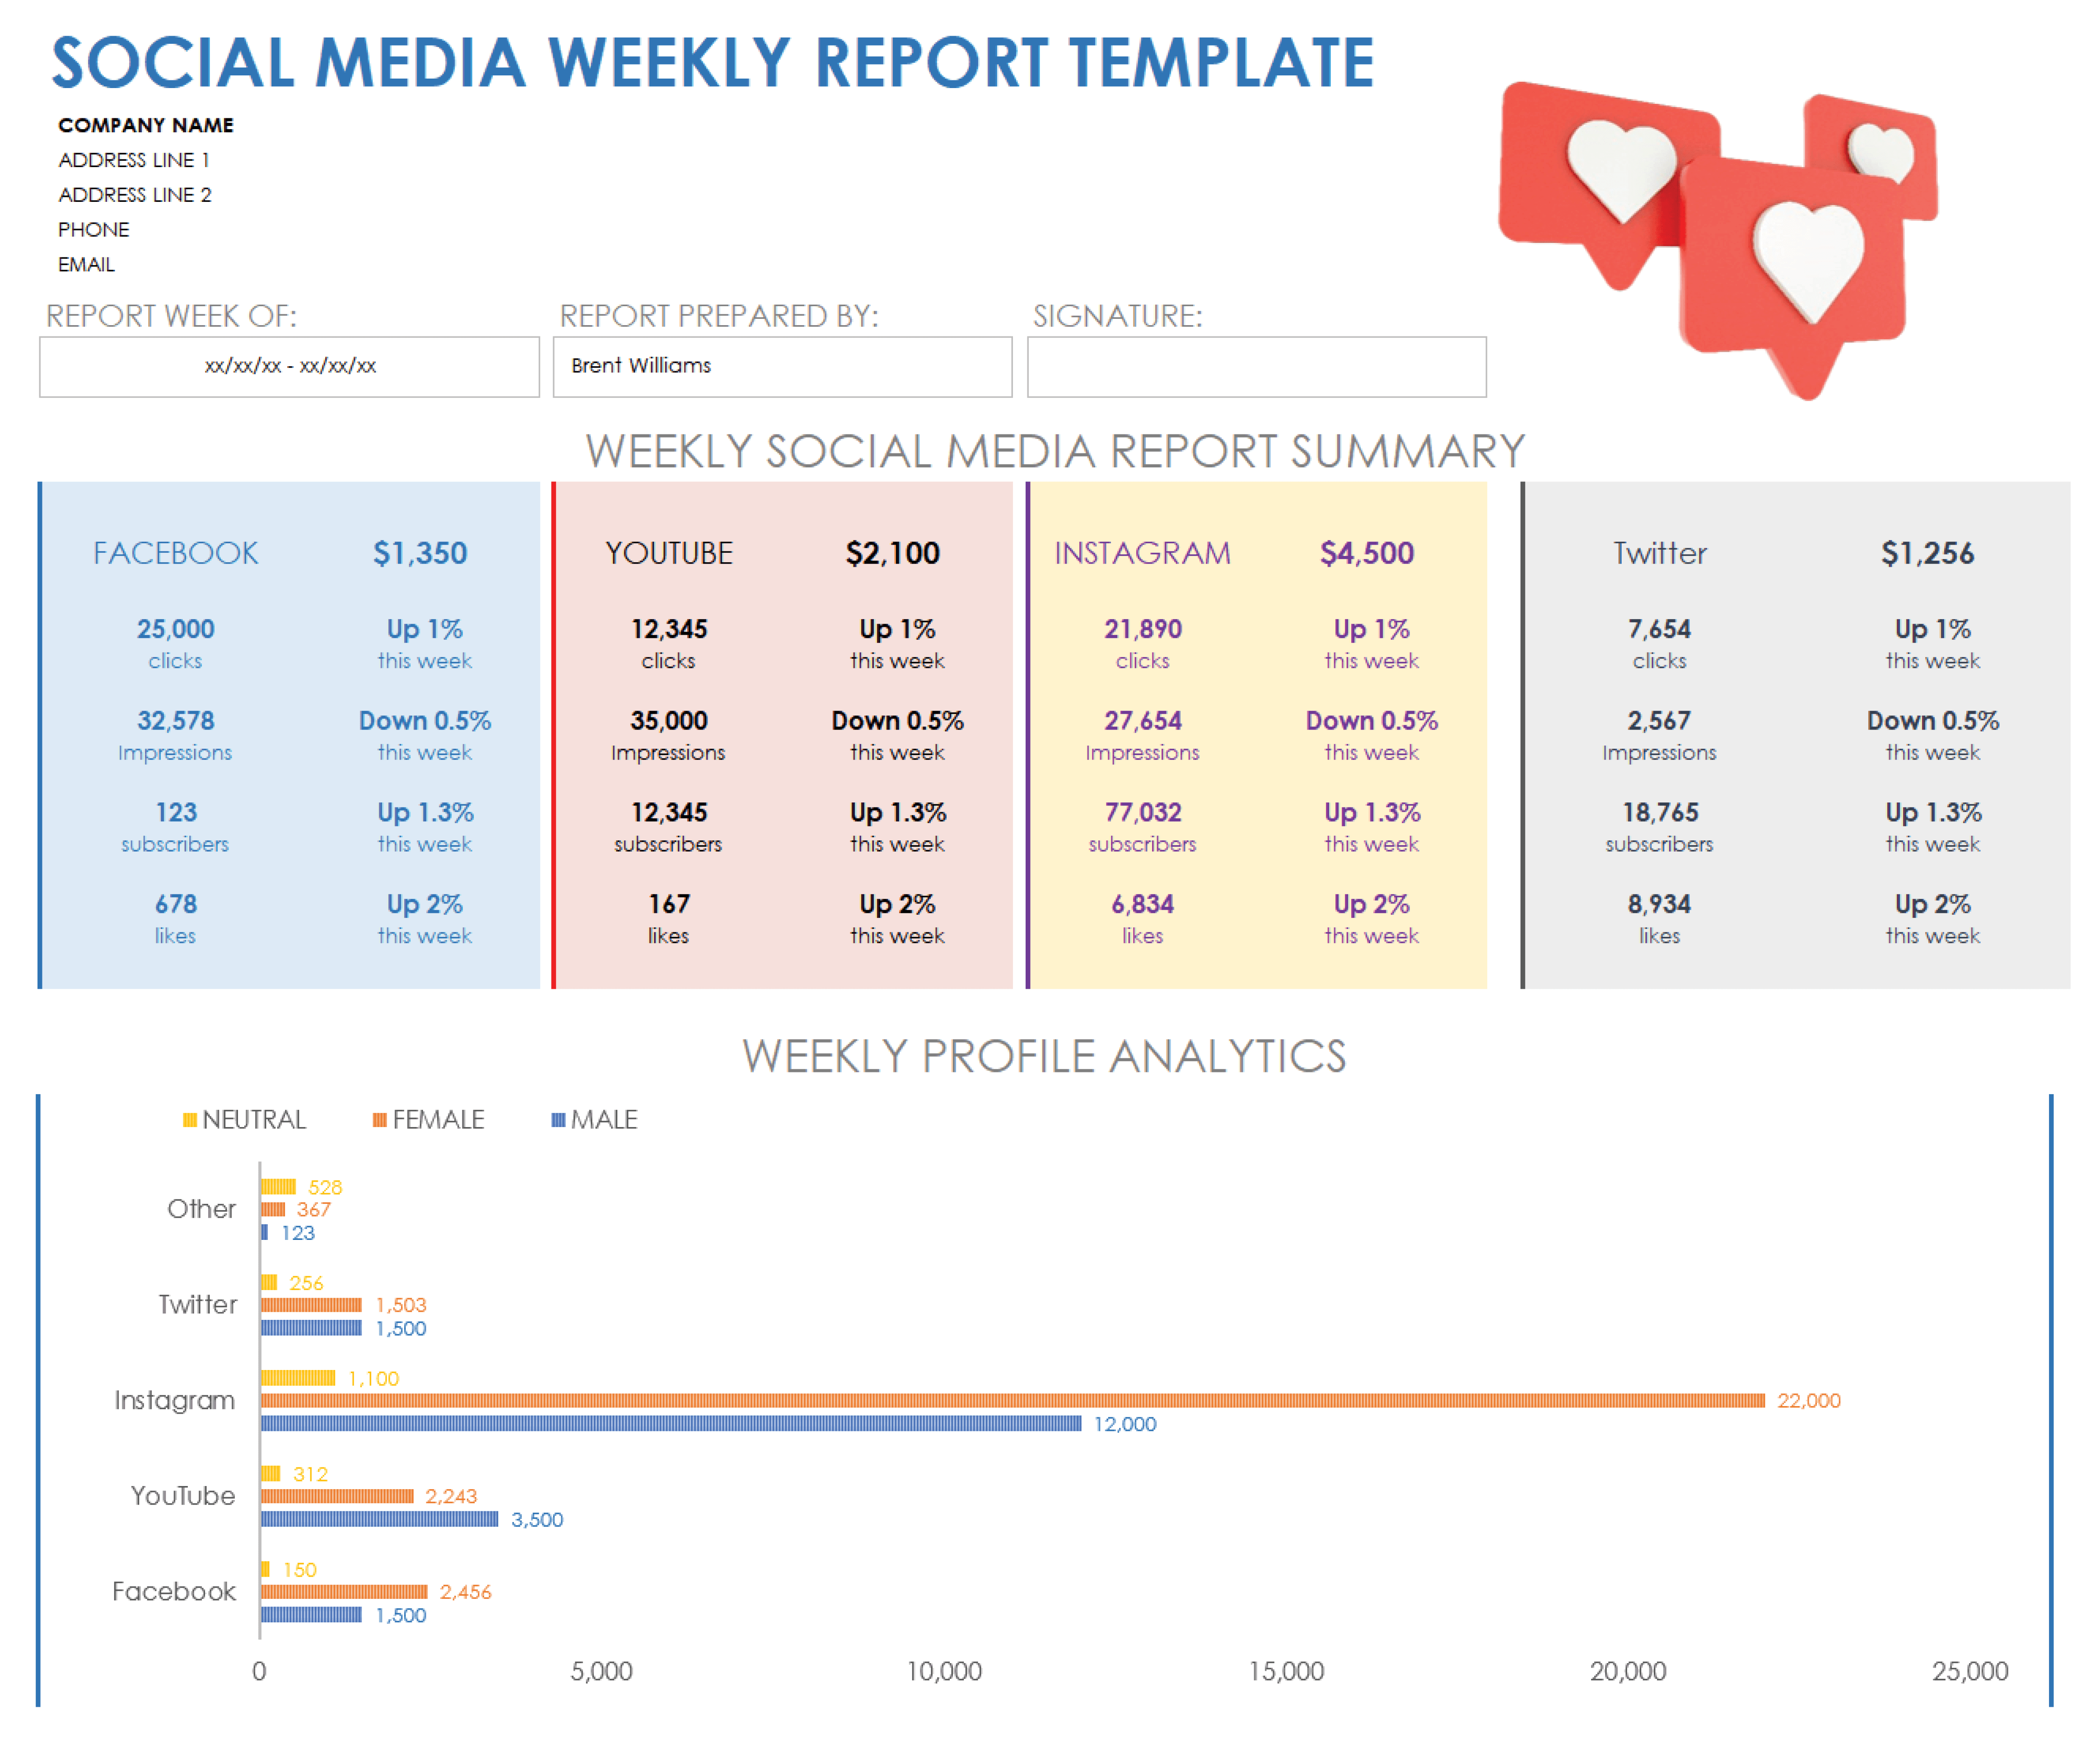
Ready to build your own? Let's get started.
Action Step 1: Create Your "Weekly Snapshot" Tab
This tab will give you a bird's-eye view of your growth across all your platforms. It's where you'll see the results of all your hard work in one place.
Let's turn to a great resource that provides a clear template for this.
Social Media Metrics Tracking Dashboard Template
This article from the blog Mean.CEO provides a fantastic, detailed framework for a tracking dashboard. We're going to adapt its 'Weekly Snapshot' structure for our personal brand.
Open this article and scroll down to 'Part 2: Setting Up Your Tracking Dashboard'. We'll be focusing on the structure provided under 'Tab 1: Weekly Snapshot Dashboard'. Notice how it organizes key metrics from different platforms side-by-side.
Now, let's build it.
Your Task:
- Open a new spreadsheet in Google Sheets.
- Rename the file to something like "My Social Media Analytics".
- Rename the first tab at the bottom of the screen from "Sheet1" to "Weekly Snapshot".
- In the first row, create the following column headers. We are adapting the structure from the article to fit your specific platforms and goals:
| Week Of | IG Followers | IG Growth | IG Eng. Rate | TikTok Followers | TikTok Growth | TikTok Eng. Rate | YouTube Subs | YT Growth | Pinterest Followers | X Followers |
|---|
A few notes on these columns:
- Week Of: This is where you'll put the date for the start of the week you're measuring (e.g., "Oct 23, 2023").
- Growth: This will be a simple calculation:
(current week's followers) - (last week's followers). This shows your raw follower increase. - Eng. Rate: This is the Engagement Rate we defined in the last lesson. You'll calculate this using data from your other tabs. We'll get to that next.
Action Step 2: Create Your "Platform Deep Dive" Tabs
This is where you'll do the groundwork. Each week, you'll visit the analytics section of each social media app and log the numbers into these tabs. This raw data will then feed your "Weekly Snapshot".
The mean.ceo article also provides an excellent structure for this under its "Tab 2: Platform-Specific Metrics" section. We'll create a separate tab for each platform to keep things clean.
Your Task:
Create a new tab for each of your platforms and set up the columns as follows. To add a new tab, click the "+" icon in the bottom-left of your Google Sheet.
1. New Tab: "Instagram Data"
Rename a new tab to "Instagram Data" and create these columns:
| Date | Followers | Reach | Impressions | Profile Visits | Likes | Comments | Shares | Saves |
|---|
2. New Tab: "TikTok Data"
Rename a new tab to "TikTok Data" and create these columns:
| Date | Followers | Video Views (7d) | Profile Views (7d) | Likes (7d) | Comments (7d) | Shares (7d) |
|---|
3. New Tab: "YouTube Data"
Rename a new tab to "YouTube Data" and create these columns:
| Date | Subscribers | Views (28d) | Watch time (hours, 28d) | Impressions (28d) | Likes (28d) |
|---|
4. New Tab: "Pinterest Data"
Rename a new tab to "Pinterest Data" and create these columns:
| Date | Followers | Impressions | Saves (Pin Clicks) | Outbound Clicks |
|---|
5. New Tab: "X (Twitter) Data"
Rename a new tab to "X Data" and create these columns:
| Date | Followers | Impressions | Engagements | Profile Visits |
|---|
Remember the note from the Buffer article: native analytics on X are now only available for premium subscribers. For now, you can still track follower count manually.
Your Weekly Analytics Workflow
You've built the tool! Now, here is the simple weekly process you will follow:
- Set a time: Pick one day a week to be your "Analytics Day". For example, every Monday morning.
- Collect Data: Go into the native analytics for each platform (e.g., Instagram Insights, TikTok Analytics). Set the date range to the previous 7 days.
- Log Raw Data: Enter the numbers you see into the appropriate "Platform Deep Dive" tab in your spreadsheet.
- Update Your Snapshot: Go to your "Weekly Snapshot" tab.
- Enter the new follower counts for each platform.
- Calculate the "Growth" column.
- Calculate the "Eng. Rate" for each platform using the formula from our last lesson:
- For Instagram, this would be
(Likes + Comments + Shares + Saves) / Reach. - For TikTok, this would be
(Likes + Comments + Shares) / Video Views.
Doing this consistently every week will build a powerful historical record of your performance.
Conclusion
Excellent work! You have just created a crucial tool for your journey as a creator. This spreadsheet is more than just a place to store numbers; it's your personal analytics dashboard that will empower you to make informed decisions about your content.
Key Takeaways:
- Tracking your KPIs in a spreadsheet is a foundational skill that forces you to understand your numbers.
- A good structure separates a high-level "Weekly Snapshot" from more detailed "Platform Deep Dive" tabs.
- Your weekly workflow consists of collecting data from each platform's native analytics, logging it in your deep dive tabs, and updating your snapshot to see the big picture.
Preview of the Next Lesson:
You've built the house, but now you need to find the furniture. In our next lesson, we'll go on a tour of each platform's analytics tools. You will learn exactly where to find the data for each metric in your spreadsheet and how to use those tools to identify your best-performing content formats and topics. This is where the real fun begins—turning data into insights