Recommended resources
The freely available resources this lesson will direct you to.
Introduction
Welcome back! In our last lesson, you built your own social media command center: a tracking spreadsheet to monitor your Key Performance Indicators (KPIs). You now have the "what" (the metrics to track) and the "where" (a place to log them).
Today, we'll dive into the "how" and the "why." This lesson is a guided tour of the analytics dashboards on Instagram, TikTok, and Pinterest. Our goal is to use these powerful, free tools to find your best-performing content formats and topics from the last month. Instead of guessing what your audience enjoys, you'll learn to listen to the data. By the end of this lesson, you'll be able to confidently identify which of your posts are resonating most with viewers and why, allowing you to create more of what works.
What Does "Best-Performing" Mean?
Before we dive into the analytics, it's important to know what we're looking for. "Best" can mean different things depending on your goal for a piece of content. For your "cheap and cheerful" niche, we'll focus on two main goals:
- Growth (Reaching New People): The best content for growth reaches a high number of people who don't follow you yet. The key metric here is Reach.
- Community (Engaging Your Followers): The best content for community building gets a strong reaction from your existing audience. The key metrics here are Likes, Comments, Shares, and especially Saves.
Saves on Instagram and Pinterest, and Shares on TikTok are "super-engagements." They signal that your content is so useful (like a great money-saving tip) that people want to keep it for later or pass it along. Pay close attention to these!
Instagram Insights: Finding Your Winners
Let's start with Instagram. Its built-in analytics tool, "Insights," is fantastic for understanding what content is working. You'll need to have a Creator or Business account, which you should have set up in Module 2.
The best way to learn is by seeing it in action. This video will walk you through the main dashboard.
How to Use Instagram Analytics to Grow Faster
The social media experts at Later provide a clear, quick tour of the Instagram Insights dashboard. This video will show you exactly how to navigate to your analytics and start sorting your content to find your top performers.
Watch the following sections: From 00:20 to 01:20: This shows you how to access your Insights and, most importantly, how to change the date range to 'Last 30 days'. From 01:45 to 02:33: This is the core of our task. Pay close attention to how you can go into the 'Content you shared' section and filter your posts by different metrics like 'Reach', 'Likes', 'Saves', and more. This is how you'll identify your best content.
Your Action Step on Instagram
Now it's your turn. Open the Instagram app and follow these steps:
- Go to your profile and tap Professional dashboard.
- Tap on See all next to "Account insights."
- In the top-left corner, change the date range to Last 30 days.
- Scroll down to Content you shared. This is your goldmine. You'll see rows for Posts, Stories, Reels, etc.
Let's find your top content:
- For Growth: Tap on the arrow next to your Reels. At the top, tap the filter (it might say "Reach" by default). Make sure Reach is selected. The Reels you see at the top are the ones that reached the most people. What are they about? What hooks did you use?
- For Community: Now, tap the filter again and select Saves. Are the top Reels the same? Often, the content people save is different from the content with the highest reach. The posts with the most saves are your most valuable, practical tips.
Do this for your Posts as well. Compare what gets the most Reach versus the most Saves and Comments.
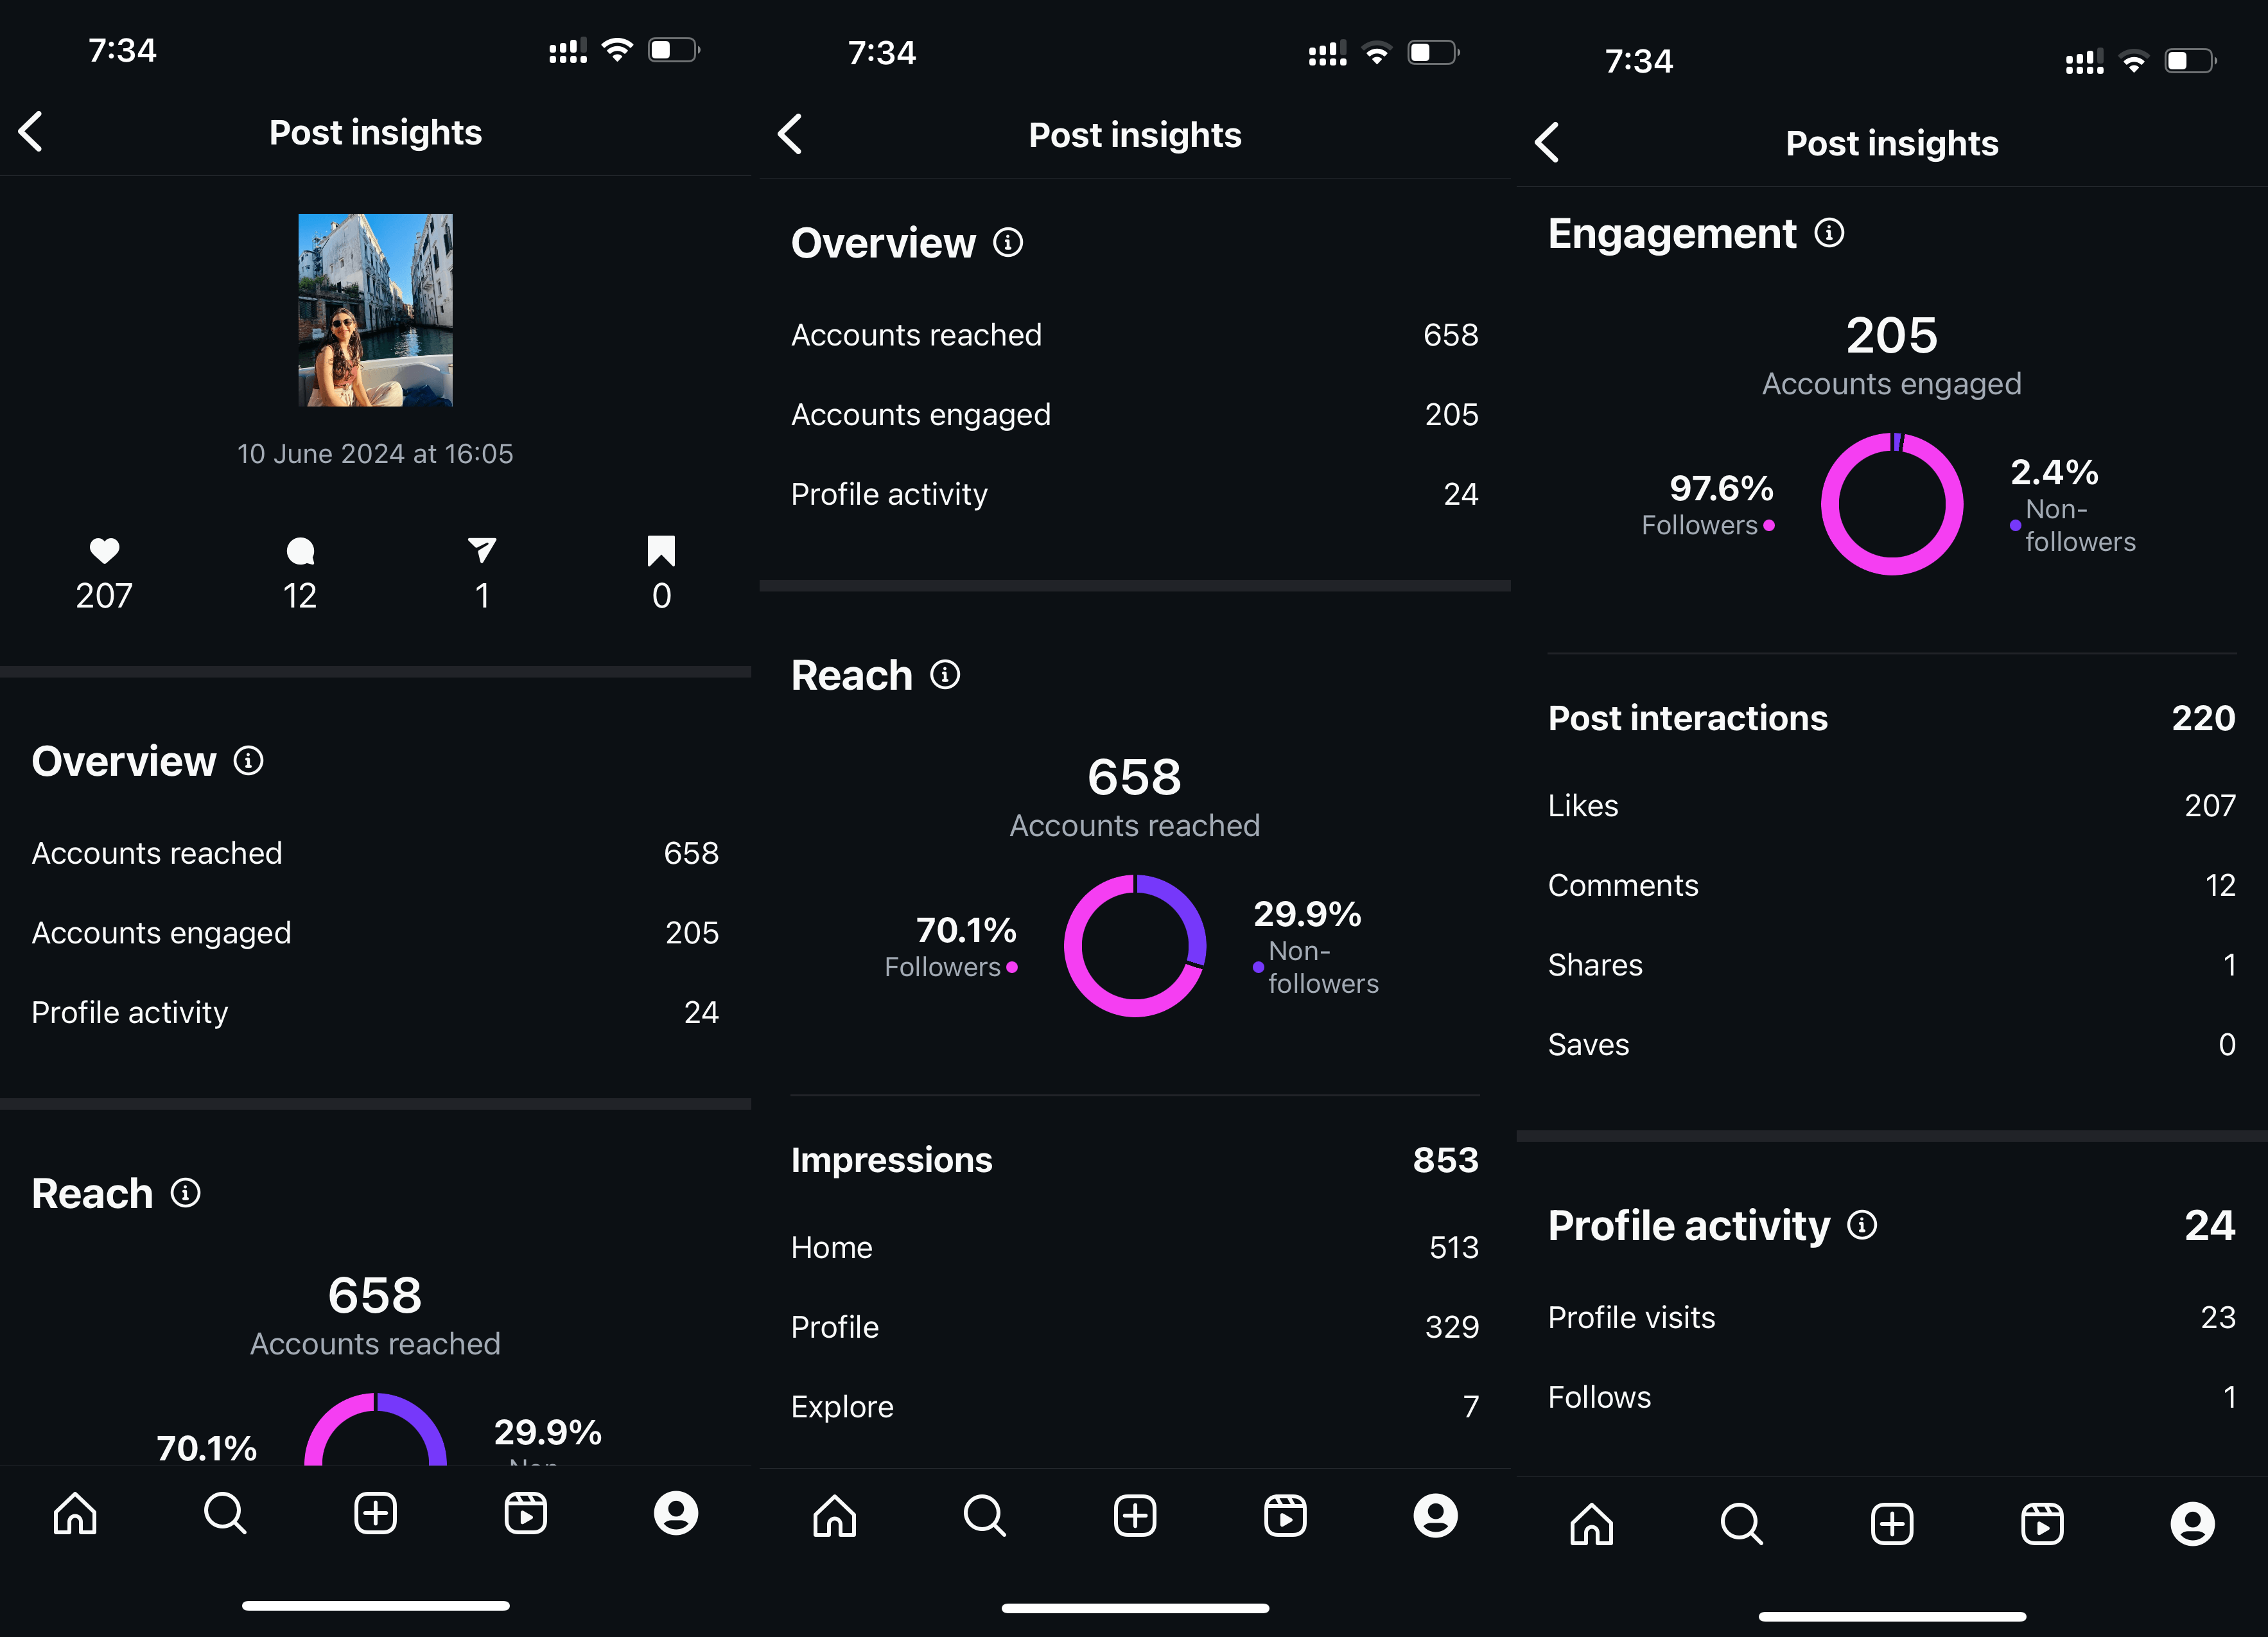
For a handy reference on what all these terms mean, you can review this official guide from Meta.
Use Insights to grow your business on Instagram
Meta, the company behind Instagram, offers a course on understanding Insights. This text provides clear definitions for all the key metrics.
You don't need to read this whole document. Just use it as a reference. Focus on the sections under 'Accounts you’ve reached' and 'Accounts you’ve engaged'. The section 'Engagement' under 'Content you shared' is also very helpful for understanding how to sort your content by interactions.
TikTok Analytics: Decoding the For You Page
TikTok's analytics are a bit different but just as powerful. They help you understand what the algorithm is pushing on the "For You" page and why.
This guide from Buffer provides a great overview of where to find everything.
TikTok Analytics: What You Need to Know
This article from Buffer is a fantastic guide to TikTok's analytics dashboard. We'll use it to locate the 'Content' tab, which is where you'll find data on your individual videos.
Read the following sections: 'How to access analytics on your TikTok account': Follow these simple steps to get to your dashboard. 'Content' (under 'The 4 main sections'): This explains what you'll find in the content tab, which is our focus. 'See what works' (under 'How to use your TikTok analytics...'): This part gives you a clear strategy for looking at your top posts.

Your Action Step on TikTok
- Open the TikTok app, go to your profile, and tap the three lines in the top-right corner.
- Select Creator tools, then tap on Analytics.
- Tap the Content tab at the top.
- By default, it shows data for the last 7 days. Change the filter to Last 28 days.
Now, look at the Trending videos section. These are your top-performing videos from the last month.
- Identify Patterns: What do your top 3-5 videos have in common?
- The Topic: Are they all about grocery savings? Budget travel?
- The Format: Are they talking-head videos? Quick cuts with text on screen? Voiceovers?
- The Hook: How did you start the video? Did you ask a question? State a controversial opinion?
- Dig Deeper: Tap on one of your top videos. Look for the Average watch time. A high average watch time tells TikTok that your video is engaging and worth showing to more people.
Pinterest Analytics: Uncovering Search Trends
Pinterest acts more like a visual search engine than a social network. Your analytics here will tell you what topics people are actively searching for that lead them to your content.
This video gives a great tour of the Pinterest analytics dashboard.
Pinterest Analytics: A Simple Guide to Read & Analyze Your Data
In this video, Pinterest expert Heather Farris walks through the analytics dashboard. She explains the most important metrics for creators and shows you how to find your top-performing Pins and Boards.
Watch the following sections carefully: From 02:07 to 03:39: Get familiar with the key Pinterest metrics: Impressions, Pin Clicks, Saves, and Outbound Clicks. 'Saves' and 'Outbound Clicks' are especially important for you. From 07:18 to 09:40: See how to navigate to the analytics overview and set your date range. From 10:20 to 12:01: This is the most important part. Learn how to find your 'Top Pins' and 'Top Boards' and sort them by different metrics to see what's truly popular.
Your Action Step on Pinterest
- Log in to your Pinterest account on a desktop computer for the best experience.
- Click Analytics in the top-left, then select Overview.
- Set the date range to the Last 30 days.
- Scroll down to the Top Pins section.
Let's find your best Pins and topics:
- Most Saved Content: By default, it might sort by "Engagements." Click the dropdown and select Saves. The pins at the top are what your audience finds most valuable and wants to return to. These are winning ideas!
- Best Traffic Drivers: Now, change the filter to Outbound clicks. These are the pins that successfully made people leave Pinterest to visit your blog, YouTube, or other linked sites. This is a huge goal for many creators.
- Most Popular Topics: Scroll down further to Top Boards. This tells you which of your topic categories are getting the most attention. If your "Budget Meal Prep" board is getting the most impressions and saves, that's a clear signal from your audience to create more content about that topic!
Conclusion
Congratulations! You've just taken a massive step from being a content creator to being a content strategist. By exploring the analytics dashboards, you've learned to let the data guide your decisions. You no longer have to guess what works; you can see it for yourself.
Key Takeaways:
- Define "Best": Your best content can be measured by Reach (for growth) or Engagement (for community). Metrics like Saves and Shares are powerful indicators of high-value content.
- Use the "Content You Shared" Filter: On Instagram, sorting your content by different metrics (Reach, Saves, Comments) is the key to finding your top posts and Reels.
- Analyze Trending Videos: On TikTok, the "Content" tab reveals your trending videos. Look for patterns in topics, formats, and hooks.
- Focus on Saves and Clicks: On Pinterest, your "Top Pins" sorted by Saves and Outbound Clicks tell you what content is most valuable and drives action. Your "Top Boards" reveal your most popular topic categories.
Preview of the Next Lesson:
Now that you know what content resonates with your audience, the next logical question is when should you post it? In the next lesson, we will revisit these same analytics tools to determine the optimal days and times to post on each platform, ensuring your best content gets the maximum possible visibility.