
In our last session, you successfully launched your application on the iOS Simulator using the bunx cap run ios command. This demonstrated that your entire development toolchain is correctly configured. While the Capacitor CLI offers a fantastic, streamlined workflow for quick iterations, there will be many instances where you need more direct control over the native project.
This lesson transitions from the high-level CLI to the native Integrated Development Environment (IDE). We will focus on building and launching your application directly from within Xcode. Mastering this workflow is essential for native debugging, configuring project-specific settings, and diagnosing complex build issues. It gives you a transparent view into the native compilation and linking process, moving beyond the "black box" of the CLI.
The CLI vs. The IDE: Two Complementary Workflows
Before diving into Xcode, it's important to understand when to use each workflow. The Capacitor documentation touches upon this choice.
Development Workflow | Capacitor Documentation
This document briefly contrasts the different ways to test your Capacitor application.
Read the section titled Testing your Capacitor app. The key takeaway is that both the CLI and the native IDEs (Xcode for iOS) are valid and officially supported approaches.
To summarize the trade-offs:
bunx cap run ios: Best for rapid development cycles when you are primarily making changes to your web code. It automates syncing, building, and launching, saving you several manual steps.- Xcode: Essential when you need to interact with the native layer. This includes:
- Editing native code (Swift/Objective-C).
- Configuring project settings like signing, capabilities, and permissions (which we will do in the next lesson).
- Using Xcode's advanced debugging and performance profiling tools.
- Resolving native build or dependency errors.
As an experienced developer, you know the value of understanding the underlying tools. Using Xcode directly demystifies the native build process and gives you complete control.
Opening the iOS Project in Xcode
Capacitor provides a convenience command to open your native project in the correct IDE.
Development Workflow | Capacitor Documentation
The same document also shows the command for opening the native IDE.
Focus on the subsection Open your Native IDE.
From the root of your monorepo, run the command, adapting it for bunx as you've done before:
bunx cap open ios
This command locates the ios/App/App.xcworkspace file in your project and opens it in Xcode. It's crucial to always open the .xcworkspace file, not the .xcodeproj file. The workspace file contains not only your main application project but also the Pods project, which manages all the native dependencies (like the Capacitor framework itself) installed by CocoaPods. Opening only the project file would lead to "module not found" errors during the build.
Building and Running from the Xcode IDE
With your project now open in Xcode, you'll see the full native project structure. While it can look complex, the process to build and run is straightforward.
The Capacitor documentation provides a concise visual guide for this process.
Getting Started | Capacitor Documentation
The official iOS guide shows exactly which UI elements to use.
Read the short section titled Running in Xcode. Pay close attention to the annotated screenshot, which highlights the two controls you will use.
Let's walk through the steps, referring to the elements shown in the documentation's image.
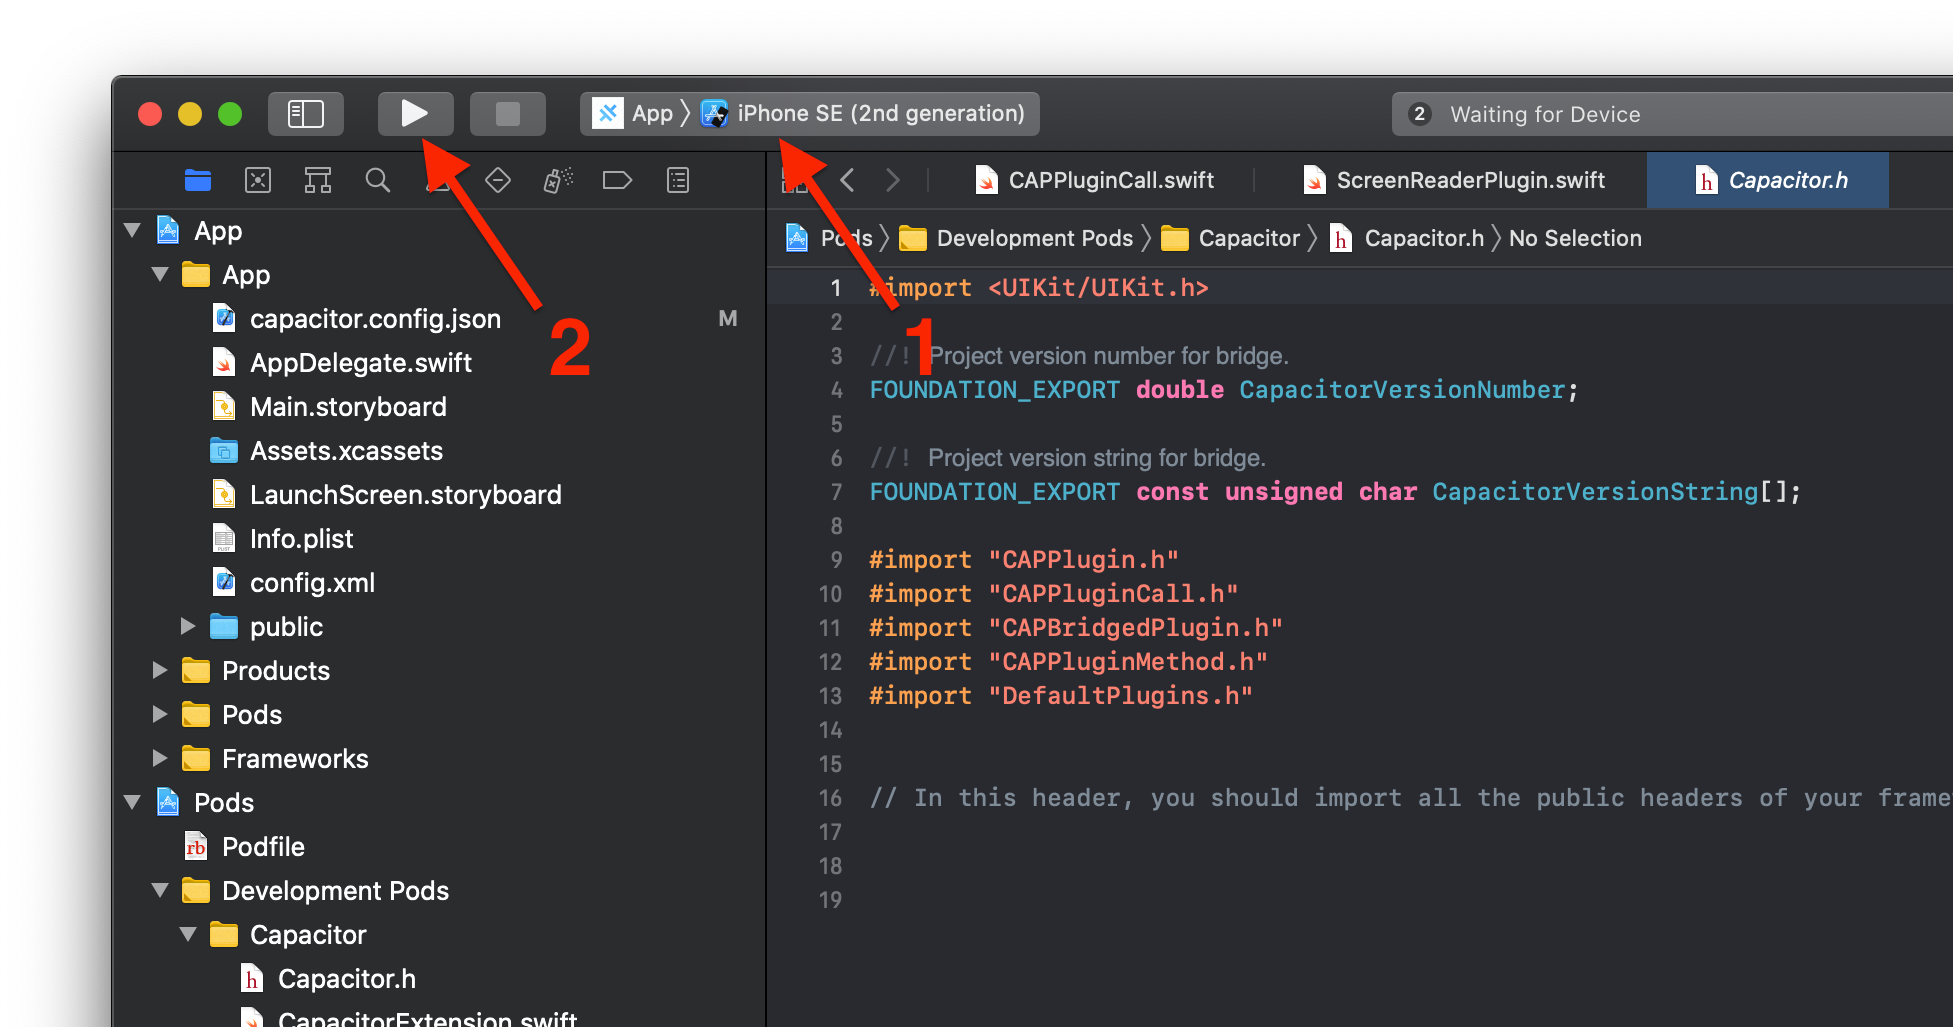
- Select a Target Device/Simulator: In the toolbar at the top of the Xcode window, you'll see a dropdown menu. This is the scheme and device selector (labeled
1in the image above). Click on it. You will see a list of all installed iOS Simulators (e.g., iPhone 14 Pro, iPhone SE) and any physically connected devices. Select one of the simulators. - Initiate the Build: To the left of the target selector, you will find a "play" icon (labeled
2). This is the Run button. Click it.
Xcode will now begin the build process. You can monitor its progress in the status bar at the top of the window, which will display messages like "Building...", "Linking...", and "Running App on iPhone 14 Pro". This process compiles all the Swift code, links the CocoaPods dependencies, and packages everything into an .app file.
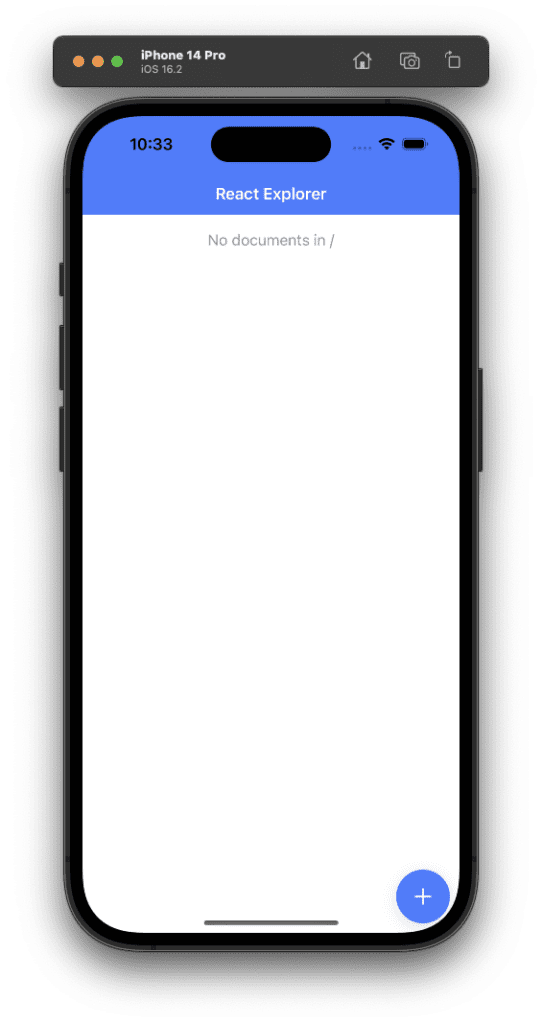
If the build is successful, the iOS Simulator will launch automatically, boot up, and your application will appear, just as it did when you used the CLI.
A Key Advantage: The Xcode Debug Console
One of the most immediate benefits of running from Xcode is access to the integrated debug console. Any console.log() statements in your React code are automatically bridged and printed to the Xcode console.
Try this:
- Add a
console.log('App mounted successfully!');statement to theuseEffecthook in your mainApp.tsxcomponent. - Re-build your web app:
bun run build(or your equivalent script). - Sync the changes to the native project:
bunx cap sync ios. - Go back to Xcode and click the Run button again.
When your app launches in the simulator, look at the bottom pane in Xcode (the Debug Area). You should see your "App mounted successfully!" message printed there, alongside any other system or Capacitor log messages. This unified logging is invaluable for debugging issues that span both the web and native layers.
Conclusion
In this lesson, you've learned to manage the iOS build and launch process directly from the Xcode IDE, giving you a powerful alternative to the all-in-one Capacitor CLI command.
Here are the key takeaways:
- The
bunx cap open ioscommand is the standard way to open your project in Xcode, ensuring you load the correct.xcworkspace. - The Xcode workflow involves selecting a target simulator from the scheme selector and clicking the Run button to compile and launch the app.
- Running from Xcode is essential for native-level tasks, debugging, and configuration.
- A major advantage of using Xcode is the unified debug console, which displays
console.logoutput from your web view alongside native logs.
You now have two effective workflows for running your app on the iOS simulator. In our next lesson, we will take the next logical step: running the app on a physical iOS device. This will require us to stay within Xcode to configure code signing, a critical step for all iOS development.
Can't find a good explanation? Sign up and we'll make it for you
Sign up