Hello! Welcome to the next lesson in our journey to build your AI-powered accelerator.
In our last session, we focused on setting up AI-powered dashboards to get a real-time, high-level view of your portfolio's health. We established that these dashboards answer the critical question: "What is happening?"
Today, we'll go a level deeper. A dashboard might show a company's revenue is flat, but it won't tell you why or whether this is a temporary slump or a sign of a fundamental problem. This lesson tackles that next step, directly addressing the learning outcome: to design processes to use AI for interpreting portfolio data and identifying companies at risk.
We will explore how you can build automated systems that not only visualize data but also analyze it, generate hypotheses, and flag potential "at-risk" investments. This allows you, as a solo GP, to move from simply monitoring performance to proactively diagnosing issues and allocating your time to the companies that need it most.
1. Beyond the Dashboard: Classifying Portfolio Risk
The first step in managing risk is to define it. In venture capital, risk isn't just about the chance of failure; it's also about the opportunity cost of supporting a company that is unlikely to generate venture-scale returns. A sophisticated AI process can help you classify your portfolio companies into actionable categories.
One of the most effective frameworks for this comes from data-driven funds that use machine learning to predict startup outcomes.
Inside Rebel Theorem 4.0: How Machine-Learning-Driven ...
Let's look at a real-world example from Rebel Fund, a VC that uses a machine learning model called 'Rebel Theorem' to guide its investments. Their article provides a clear framework for classifying startups, which is a perfect starting point for our own risk identification process.
Please read the following parts of the article: The introductory section, 'The Leap to Rebel Theorem 4.0', which introduces the core classification. The section on 'AI-Driven Advantages in Portfolio Construction'. The part of 'Performance Analysis' that discusses the 'Algorithmic vs. Traditional Selection Methods'. Focus on understanding their three-category classification system: 'Success', 'Zombie', and 'Dead'.
As the article explains, a simple binary "success/failure" model is too crude. The 'Success, Zombie, Dead' framework offers a more nuanced and actionable approach:
- Success: Companies with high growth potential that are on track to deliver significant returns. These are where you might double down with follow-on funding or strategic support.
- Zombie: Companies that are self-sustaining but have stalled in growth. They aren't dead, but they are unlikely to produce the 10x+ returns a VC fund needs. These require a specific strategy (e.g., finding a small acquisition, managing for cash flow, or simply not investing more time/money).
- Dead: Companies that are clearly failing and are on a path to shutting down. The goal here is to manage the wind-down process gracefully and learn from the experience.
An AI system that can help you sort your portfolio into these categories is incredibly powerful. It allows you to triage your attention and resources with strategic precision, a crucial capability for a solo GP.
2. Designing the Process: From Rules to Agentic Workflows
Now that we have a target output (classifying a company), how do we design the process to get there? We need a system that can automatically gather data, apply logic, and generate an assessment. Your computer science background will be helpful here, as these systems are essentially intelligent, automated flowcharts.
A simple risk-assessment process can be visualized as a set of rules.
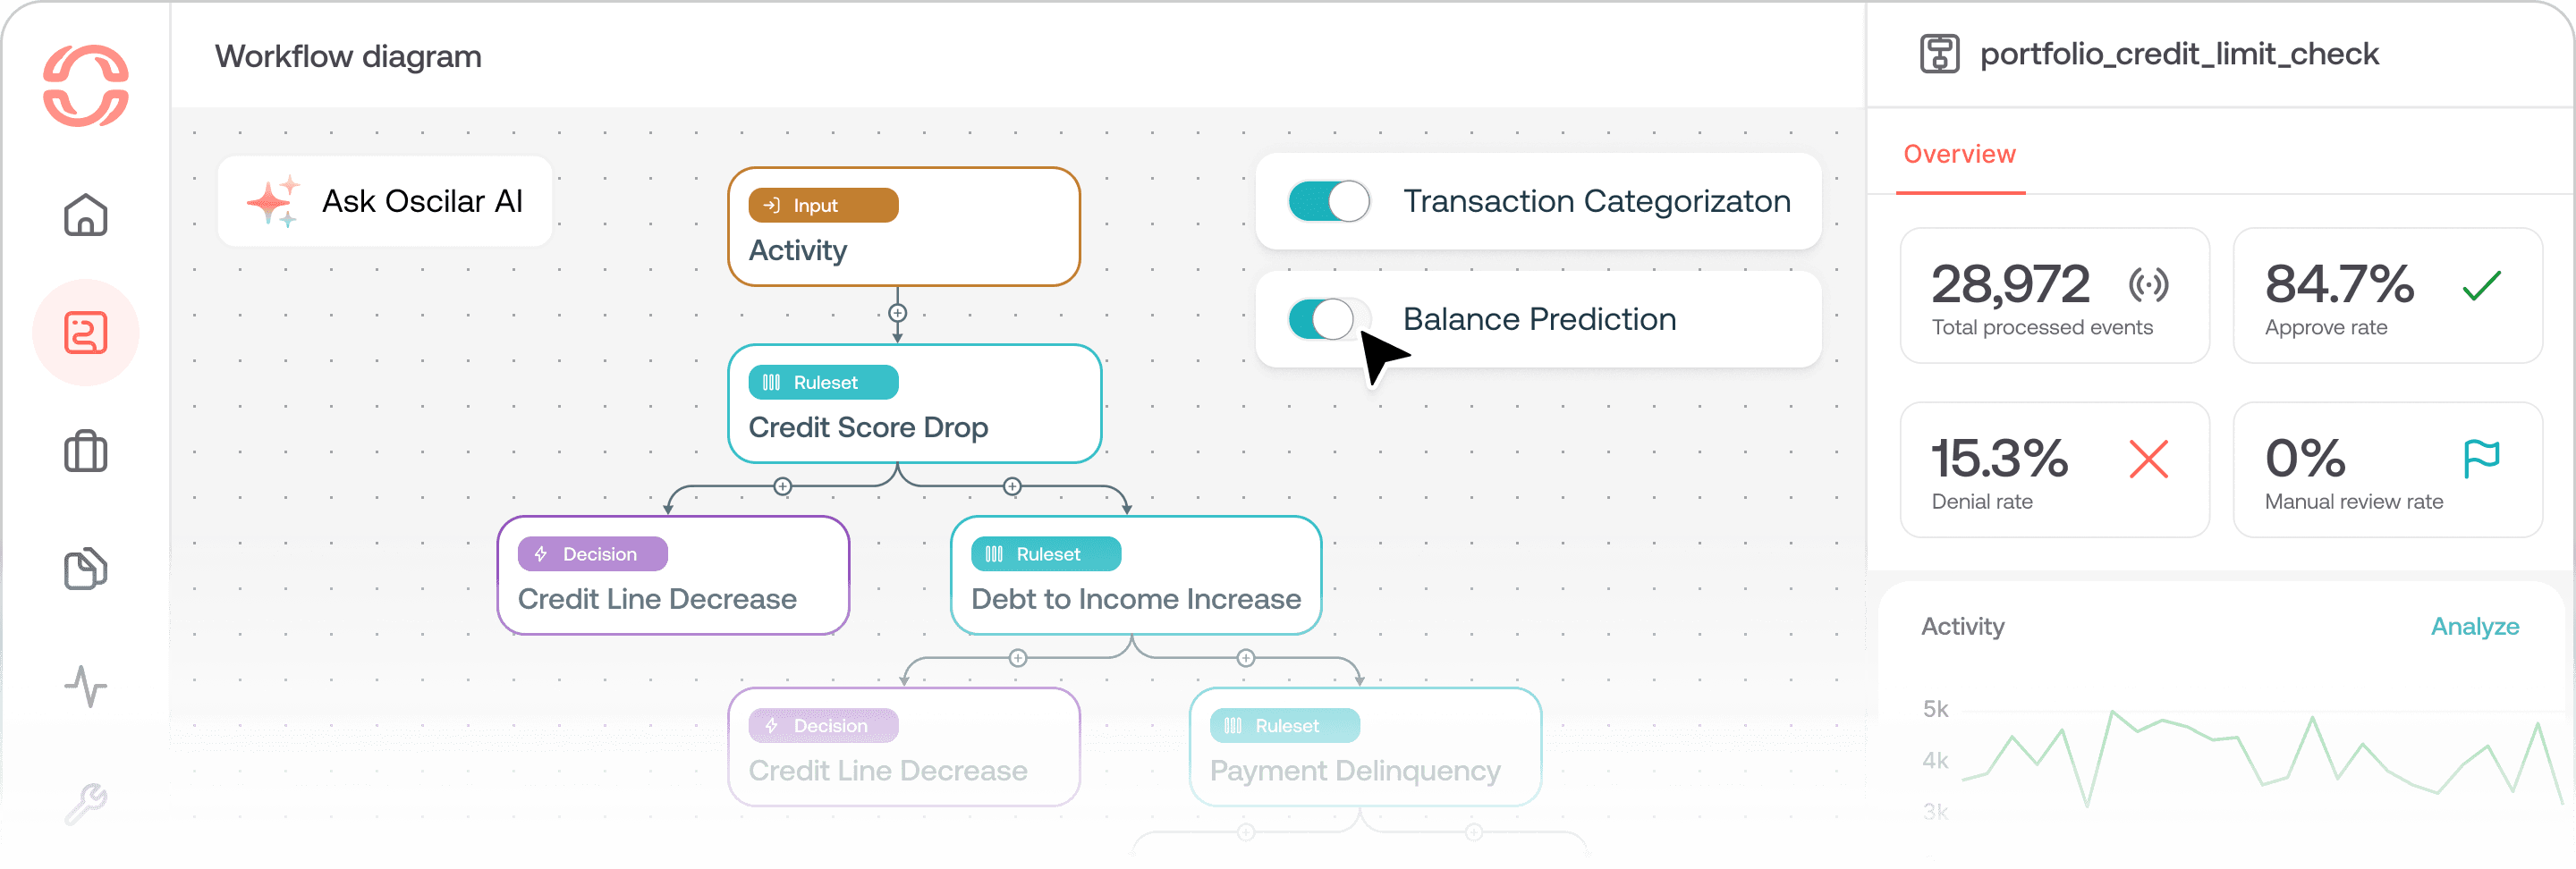
This visual shows a basic IF-THEN logic. For a portfolio company, a rule could be: IF Runway < 6 months AND Monthly_Growth < 0% THEN Flag as 'At-Risk'.
However, we can create much more sophisticated processes using "agentic AI." Think of an AI agent as an autonomous program that can use tools to perform multi-step tasks.
Agentic AI for Finance: Workflows, Tips, and Case Studies
The CFA Institute provides an excellent guide on 'Agentic AI for Finance'. We will focus on a specific case study that demonstrates exactly how to build a workflow to assess a company's health—a perfect blueprint for our goal.
Please read 'Case Study 1: Fundamental Assessment Agentic Workflow' in its entirety. You can expand each of the six steps to see the details. Pay close attention to how the workflow combines user input, data retrieval, conditional logic (routing), and LLM-based analysis to produce a final, scored assessment.
The case study you just read is a practical template for designing your own risk-assessment process. Let's break down its key steps in the context of your accelerator:
- Inputs: The process starts with a company (
ticker) and a macro context (Economic Regime). You could define regimes like 'High-Growth Market', 'Recessionary Environment', or 'Intense Competition'. - Tool Use (Data Retrieval): The agent automatically pulls financial data. In your case, this would mean connecting to the data source you established in the previous lesson (e.g., a standardized reporting spreadsheet, QuickBooks API, Stripe API).
- Routing (Conditional Logic): The workflow branches based on the economic regime. This is a critical insight: a company's health metrics should be interpreted differently depending on the market environment. In a recession, high cash reserves might be more important than rapid growth.
- Calculation & AI Analysis: The system calculates regime-specific metrics and then, crucially, uses an LLM to provide qualitative commentary and check for anomalies. This moves beyond simple numbers to generate nuanced insights, such as noting that "EBITDA decline tied to unusual items and lower ops income."
- Output (Scored Assessment): The final output is a score and a clear, human-readable explanation. This is the "interpretation" we're after—transforming raw data into a decision-ready assessment.
This kind of agentic workflow is the core of an AI-driven interpretation process. It's systematic, context-aware, and scalable.
Test your understanding!
Imagine you're adapting the "Fundamental Assessment Agentic Workflow" for your accelerator. You have a portfolio company that is a B2B SaaS startup. You've selected the "High-Growth Market" regime.
Based on the logic of the case study, what are 2-3 specific metrics the workflow should calculate and analyze for this company under this regime, and why are they particularly relevant?
Show answer
In a "High-Growth Market" for a B2B SaaS startup, the focus would be on capturing market share and validating the business model's efficiency. Good metrics would be:
- Net Revenue Retention (NRR): This metric measures revenue growth from your existing customer base (including upsells and churn). An NRR > 100% is a powerful indicator of product-market fit and a scalable business model, which is paramount in a high-growth phase.
- LTV:CAC Ratio: The ratio of Customer Lifetime Value to Customer Acquisition Cost. In a growth phase, you're spending heavily on marketing and sales. This ratio tells you if that spending is efficient and will be profitable in the long term. A ratio > 3 is a common benchmark for health.
- Sales Cycle Length: How long it takes to close a new customer. A shortening sales cycle in a growth market could indicate increasing brand recognition and product-market fit, while a lengthening one could be an early warning sign of competitive pressure or pricing issues.
3. Implementing Your Risk Assessment Process
You don't need to replicate Rebel Fund's complex machine learning model from day one. The key is to start with a structured, data-driven process and iterate.
Step 1: Lay the Foundation with Data
An AI model is only as good as its data. The first step is to be systematic about what data you collect.
Inside Rebel Theorem 4.0: How Machine-Learning-Driven ...
Let's return to the 'Inside Rebel Theorem 4.0' article. It provides a practical guide on the essential data fields to collect, which serves as an excellent checklist for your own data strategy.
Please read the sections 'Key Data Fields and Training Methodology' and the 'Essential Data Fields to Collect' part of the 'Actionable Implementation Guide'. Focus on the three main categories of data: Founder-Level, Company-Level, and Market-Level.
As the article outlines, your data collection should be comprehensive:
- Company-Level Metrics (Quantitative): This is the data from your dashboards (revenue, burn rate, runway, etc.).
- Founder-Level Data (Qualitative/Structured): Data about the team's experience, execution track record, etc. You can capture this during diligence and through regular check-ins.
- Market-Level Signals (External): Information about market size, competitors, and trends.
Step 2: Start with a Simple Workflow
You can begin by implementing a simple rule-based workflow using no-code tools like Zapier or by writing a small script.
Example Workflow:
- Trigger: A founder submits their monthly update via a Google Form.
- Data Entry: The data automatically populates a row in a Google Sheet for that company.
- Rules Engine (in the Sheet or a script):
IF(Runway < 4, "RED_FLAG", "OK")IF(New_Bookings < [Previous_3_Month_Average], "YELLOW_FLAG", "OK")IF(Customer_Churn_Rate > 5%, "YELLOW_FLAG", "OK")
- Action: If any cell shows "RED_FLAG", an automated email is sent to you with the subject "Urgent Review: [Company Name]", and a task is created in your CRM.
This simple process already provides enormous value by automating the initial layer of interpretation and directing your attention.
Step 3: Evolve to More Complex Analysis
Once you have a consistent data flow and a few months of historical data, you can evolve. You could feed this data into a custom GPT or another LLM with a prompt inspired by the CFA case study to generate a qualitative summary, effectively graduating from a simple rules engine to a more sophisticated agentic workflow.
A final, crucial point is to be mindful of algorithmic bias, as the Rebel Fund article wisely points out in its section on "Red Flags and Model Bias Considerations." Ensure your data and models don't inadvertently penalize founders from non-traditional backgrounds. Regular human oversight is key.
Conclusion
This lesson provided a blueprint for moving beyond simple data visualization to active, AI-driven interpretation. By designing processes that automatically analyze portfolio data, you can effectively identify at-risk companies, enabling you to manage your portfolio with the strategic insight of a much larger team.
Key Takeaways:
- Adopt an Actionable Framework: Classifying companies into categories like 'Success', 'Zombie', and 'Dead' helps you triage your time and capital effectively.
- Design Agentic Workflows: Structure your analysis as a multi-step process that combines data retrieval (tools), conditional logic (routing), and LLM-powered interpretation to generate deep insights.
- Data Is Your Foundation: Systematic collection of company-level, founder-level, and market-level data is the prerequisite for any meaningful AI analysis.
- Start Simple, Then Evolve: Begin with rule-based automations to flag obvious risks, and gradually incorporate more sophisticated LLM analysis as your dataset grows.
Preview of the Next Lesson
We've now covered how to monitor your portfolio's performance and interpret the data to identify risk. The next step is communicating this performance to your own investors. In the next lesson, "Outline the key components of a standard Limited Partner (LP) report," we will focus on how to structure professional, data-driven updates that build trust and confidence with the people who have invested in your fund.