Hello! Welcome back.
In our last lesson, we focused on the top of your investment funnel, exploring how to use AI to automate the analysis of inbound pitch decks. We established that building efficient systems is critical for a solo GP to manage a high volume of opportunities.
Today, we move from selecting companies to monitoring them post-investment. Once a startup is in your portfolio, your role shifts to supporting its growth and tracking its health. Doing this effectively across a dozen or more companies is a significant challenge for a one-person firm.
This lesson directly addresses the learning outcome: to evaluate and configure AI-powered dashboards for real-time portfolio performance tracking. We will explore why these dashboards are essential for a solo GP, what key components make them effective, and how to approach setting them up. This skill is fundamental to providing high-quality support at scale and fulfilling your duties to your own investors (LPs).
1. The Proactive Advantage: Why Real-Time Monitoring Matters
Traditionally, VCs might rely on quarterly board meetings or monthly update emails to check on their portfolio companies. This approach is reactive; by the time a problem is reported, it may have already become severe. For a solo GP, who lacks a large support team, this information lag is a major risk.
AI-powered dashboards change this dynamic by enabling proactive portfolio management. Instead of waiting for updates, you can create systems that continuously ingest and analyze key data, flagging potential issues or opportunities as they emerge.
How AI is Powering the Rise of Solo General Partners in ...
To understand this shift in portfolio management, let's read a section from the article 'How AI is Powering the Rise of Solo General Partners in Venture Capital' from the VC Fund Institute. It perfectly captures how AI acts as a 'vigilant assistant' for monitoring.
Please read the paragraphs discussing 'real-time portfolio monitoring' and 'AI-enabled fund dashboards'. You'll find them within the larger section titled 'AI in Monitoring and Supporting Portfolio Companies'. Focus on how these tools move a GP from being reactive to proactive.
As the article highlights, AI-powered monitoring provides a layer of "predictive foresight." It can spot a dip in user retention or an unusual spike in burn rate, alerting you to intervene long before it becomes a crisis. This capability is not just about catching problems; it's about scaling your ability to provide value and making informed decisions about where to allocate your most precious resource: your time.
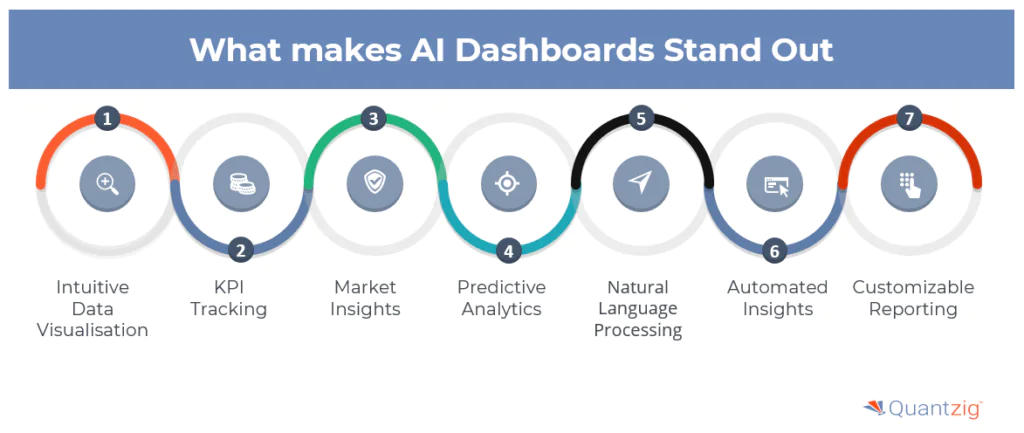
AI dashboards achieve this through a combination of powerful features.
2. The "What": Designing an Effective Portfolio Dashboard
An effective dashboard is not just a collection of charts; it's a strategic tool designed for clarity and action. The goal is to distill complex business realities into a concise, at-a-glance view that helps you make better decisions.
This involves two key design principles:
- Selecting the right Key Performance Indicators (KPIs).
- Customizing the view for the right stakeholder.
Designing AI Startup Metrics Dashboards for Enterprises
The article 'Designing AI Startup Metrics Dashboards for Enterprises' by SparkCo provides an excellent framework for thinking about this. While written for startups building their own dashboards, the principles are directly applicable to you as an investor evaluating them.
Please read the section titled 'Metrics and KPIs'. Pay close attention to the concepts of selecting '5–7 essential KPIs', customizing for different stakeholders, and balancing qualitative and quantitative data.
Selecting Essential KPIs
As the article suggests, "less is more." A cluttered dashboard with dozens of metrics is overwhelming and can hide important signals. Your first task is to define the 5-7 core KPIs that truly reflect the health and progress of a portfolio company. These will vary by business model (e.g., SaaS vs. e-commerce), but some are universal for early-stage startups.
Let's look at a concrete example.
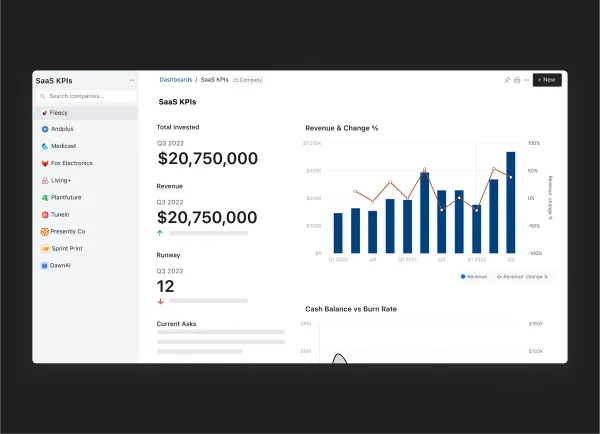
This dashboard visualizes several critical pre-seed and seed-stage KPIs:
- Revenue: The top-line income of the company. The dashboard shows both the absolute number and the quarter-over-quarter growth rate (
Change %), which is often more important. - Runway: This is the number of months a company can operate before it runs out of money, calculated as
Cash Balance / Monthly Burn Rate. For an investor, this is arguably the most critical health metric. A short runway is an immediate red flag. - Total Invested: Tracks the capital you've deployed into the company.
- Cash Balance vs. Burn Rate: This chart (partially visible) gives you a direct view of the company's financial sustainability.
By focusing on these core metrics, an investor can quickly assess: Is the company growing? Is it managing its cash effectively? Is it in danger of running out of money?
Test your understanding!
The example dashboard is for SaaS companies. Now, imagine one of your portfolio companies is a direct-to-consumer (D2C) e-commerce brand. Based on the principle of selecting a few essential KPIs, what are 3-5 different or additional metrics you would prioritize for this company on your dashboard?
Show answer
For a D2C e-commerce company, you'd focus more on transactional and marketing efficiency metrics. Good choices would include:
- Customer Acquisition Cost (CAC): How much does it cost to acquire a new customer?
- Customer Lifetime Value (LTV): How much total revenue does an average customer generate over their lifetime? The LTV/CAC ratio is a crucial indicator of business model viability.
- Gross Margin: The percentage of revenue left after accounting for the cost of goods sold. This reflects the core profitability of the products.
- Monthly Active Customers / Repeat Purchase Rate: This measures customer loyalty and retention, which is key for sustainable growth.
- Inventory Turnover: How quickly the company sells and replaces its inventory. This is vital for managing cash flow in a physical product business.
3. The "How": Configuring Your Dashboard System
"Configuring" a dashboard is less about dragging and dropping charts and more about architecting the flow of data from your portfolio companies into a system that can analyze and display it. As a solo GP, you have two main paths:
- Buy a Solution: Use a specialized VC/accelerator platform or a fund administration service that provides portfolio monitoring as part of its package.
- Build a (Simple) Solution: Leverage no-code/low-code tools to create a custom dashboard.
For most solo GPs, the "buy" option is more practical. Fund administrators like the one mentioned in the first reading (Phoenix Fund Services using Allvue) or dedicated portfolio management platforms (e.g., Visible.vc, Standard Metrics) provide ready-made infrastructure. Your job is to ensure founders report the required data consistently.
Regardless of the path, the technical and process steps are similar.
Designing AI Startup Metrics Dashboards for Enterprises
Let's briefly revisit the 'Designing AI Startup Metrics Dashboards' article to understand the implementation process. You don't need to become a software architect, but understanding the steps is crucial for working with providers or a technical team.
Please read the section 'Step-by-Step Guide to Deploying Dashboards'. Focus on the sequence of activities: from defining requirements and selecting KPIs to data source integration and dashboard design.
Here is a simplified version of that process, tailored for you as a fund manager:
- Define Requirements & KPIs (You): This is the strategic work we just discussed. You decide what you need to track for each company based on your investment thesis and their business model.
- Establish Data Collection Process (You & Founders): This is the most critical operational step. You must have a clear, consistent, and ideally automated way for founders to submit their KPIs. This could be a standardized spreadsheet template, a dedicated form, or connecting directly to their financial software (like QuickBooks) or payment systems (like Stripe) via APIs. This reporting requirement should be part of your investment agreements from day one.
- Select a Platform/Tool (You): Choose the software that will act as your central hub. This could be a comprehensive fund management platform or a business intelligence tool like Tableau or Google Data Studio connected to a database (e.g., Google Sheets, Airtable) where the data is collected.
- Configure and Visualize (You or a Provider): Set up the dashboards to display the KPIs. The AI layer comes in here, with the platform automatically calculating growth rates, flagging anomalies (e.g., burn rate is 30% higher than last month), and projecting future trends (e.g., runway projection).
Your computer science background gives you an edge in evaluating the technical feasibility of these platforms, but your primary role is strategic: defining what needs to be measured and ensuring the data flows reliably.
Conclusion
For a solo GP, an AI-powered portfolio dashboard is a force multiplier. It transforms portfolio monitoring from a reactive, time-consuming chore into a proactive, strategic function. It allows you to provide better support to your founders, make smarter follow-on investment decisions, and deliver professional, data-backed reports to your own LPs.
Key Takeaways:
- Move from Reactive to Proactive: AI dashboards enable you to spot trends and anomalies in real-time, allowing you to intervene before issues escalate.
- Focus on Essential KPIs: The effectiveness of a dashboard lies in its clarity. Prioritize 5-7 core metrics that truly reflect business health and are tailored to the company's business model.
- Systematize Data Collection: The backend process is as important as the dashboard itself. Establish a consistent and reliable method for gathering data from your portfolio companies from the very beginning of your relationship.
- Evaluate Tools Strategically: Whether you buy a specialized platform or build a simple workflow, your goal is to create a system that automates analysis and surfaces actionable insights, freeing you to focus on strategy and support.
Preview of the Next Lesson
We have now established how to build a dashboard to see what is happening in your portfolio. In our next lesson, we will focus on the next logical step: designing processes to use AI for interpreting portfolio data and identifying companies at risk. We will move from data visualization to data interpretation, exploring how you can use AI to dig deeper into the "why" behind the numbers and prioritize your attention effectively.