
Welcome back. In the previous lesson, you designed identities and permissions so that engineers, pipelines, and workloads can operate safely with short-lived, narrowly scoped access. That is an important prerequisite for observability: telemetry collectors and applications also need explicit, limited permissions to emit logs, metrics, and traces.
This lesson turns observability into an operational decision system. For an exchange-style platform, “we have Grafana and CloudWatch dashboards” is not a senior-level answer. You need to define what reliable customer behavior means, measure it consistently, alert only when action is warranted, and use error budgets to decide when release velocity must yield to reliability work.
By the end, you should be able to define an SLI/SLO package for a critical service, map it to AWS and cloud-native telemetry, explain multi-window burn-rate alerting, and defend an error-budget policy in an interview.
1. Start with a customer outcome, not a dashboard metric
An SLI is the measured indicator of service quality. An SLO is the reliability target for that indicator over a defined window. The error budget is the allowed amount of non-compliance.
For a request-based SLI, the basic model is:
For an SLO target , the error budget fraction is:
For example, a 99.95% SLO permits 0.05% bad events. If an Order API receives 40 million eligible requests during a 28-day rolling window, its maximum error budget is:
The mathematics is simple. The difficult and valuable work is defining good, total, and eligible so that the metric represents user experience without hiding platform failures.
A useful senior-level distinction is:
- SLI specification: the user outcome being judged.
- SLI implementation: the telemetry and calculation used to measure it.
For example:
| Layer | Example |
|---|---|
| SLI specification | “An authenticated customer can submit an order and receive a durable acceptance or a semantically valid rejection within 300 ms.” |
| SLI implementation | “Good, eligible order-submission events divided by total eligible events, measured at the service edge and correlated with application outcome events.” |
The specification stays stable even if you replace an ALB metric, move from ECS to EKS, or migrate from Prometheus to CloudWatch Application Signals.
Read the Google SRE Workbook chapter to anchor the distinction between user-facing SLI specifications and their concrete implementations. Its treatment of request-driven, pipeline, and storage systems is especially useful for an exchange platform with synchronous APIs and asynchronous processing.
In “What to Measure: Using SLIs,” read the ratio model. Then, in “A Worked Example,” review Table 2-1 for the SLI types appropriate to request-driven services, pipelines, and storage. Continue to “Moving from SLI Specification to SLI Implementation” and read the implementation discussion, focusing on why load-balancer metrics, logs, probes, and client instrumentation each have different coverage and fidelity.
The exchange-platform trap: treating every endpoint equally
An exchange or fintech platform has operations with very different consequences:
GET /markets/{symbol}/tickermay tolerate graceful degradation or stale data for a limited period.POST /ordersrequires a fast, unambiguous, durable response. A slow response can cause customers to retry and create uncertainty, even if the server eventually processed the order.- A risk-check service must prioritize correctness and availability, not merely a low average latency.
- An asynchronous ledger, settlement, or market-data pipeline needs freshness, coverage, and correctness indicators in addition to HTTP success rates.
Do not create one blended “platform availability” SLO from all endpoints. High-volume, low-value calls can conceal failures in a lower-volume but financially critical operation. Instead, define SLOs around critical user journeys and operation classes.
A defensible initial SLO package for an order-management domain might look like this:
| Service outcome | SLI definition | Example target |
|---|---|---|
| Order submission | Eligible submissions accepted durably or rejected semantically correctly within 300 ms | 99.95% over rolling 28 days |
| Order-status retrieval | Successful responses returned within 500 ms | 99.9% over rolling 28 days |
| Risk decision | Valid risk checks completed with a correct decision within 100 ms | 99.99% over rolling 28 days |
| Order-event pipeline freshness | Order state updates visible to the consuming service within 30 seconds | 99.9% of eligible events |
| Ledger reconciliation | Reconciled records with no unexplained mismatch | 100% of daily reconciliation runs, with explicit investigation on any mismatch |
The final row illustrates an important principle: some financial correctness properties should not be “averaged away.” An SLO can drive operational attention, but it does not replace reconciliation controls, audit evidence, or domain-specific risk limits.
Define what counts as a bad request explicitly
For the order-submission SLI, a good event could require all of the following:
- The request reaches the intended public entry point.
- The caller is authenticated and the request is syntactically valid.
- The service accepts the order durably with an idempotency key, or returns a valid business rejection.
- The response reaches the customer within the stated latency threshold.
- No service-caused 5XX, timeout, or overload response occurs.
A quick 500 response is not good. Neither is a 200 response delivered after the customer’s timeout threshold. In many services, it is clearer to combine success and latency into one user-outcome SLI:
This avoids maintaining two independent budgets where 0.1% of requests can fail quickly and a separate 1% can be arbitrarily slow.
Be deliberate about 4XX responses. CloudWatch Application Signals’ standard availability calculation treats 4XX responses as successful, because they often represent invalid client input rather than service unavailability. That is a reasonable default, not a universal truth:
- A
400for malformed input is normally excluded from platform availability failure. - A
409returned for an idempotent duplicate may be a correct business outcome. - A
401from an expired customer token is usually not an Order API availability failure. - A
429caused by your own exhausted capacity or an incorrect rate-limit policy may represent user harm and should be measured separately, or counted as bad for the relevant SLO.
The rule is not “count all 4XX as good” or “count every non-2XX as bad.” The rule is: classify outcomes according to the customer contract and document the classification.
2. Build a small, reviewable SLO document
An SLO should be concise enough to use during an incident. For each critical operation, record:
| Field | Example for POST /orders |
|---|---|
| Customer and journey | Authenticated trader submitting an order |
| SLI type | Request-based availability plus latency |
| Eligible population | Authenticated production requests, excluding known synthetic test traffic |
| Good event | Durable acceptance or valid business rejection within 300 ms |
| Bad event | 5XX, gateway timeout, service overload, or completion over 300 ms |
| Measurement source | Edge metric plus application outcome counter; synthetic canary as coverage check |
| SLO target and window | 99.95% in a rolling 28-day window |
| Error budget | 0.05%, or 20,000 bad requests at 40 million requests |
| Owner | Order domain engineering team, with SRE/platform support |
| Alert policy | Fast burn pages on-call; slow burn creates a reliability work item |
| Exclusions | Only pre-agreed, customer-notified maintenance windows, if contractually appropriate |
A rolling window is generally better for current customer experience and operational decision-making. A calendar window can be useful when reporting aligns to a calendar month or contractual reporting period. State which one you use; “99.95% availability” is incomplete without the measurement interval.
Also distinguish two SLO evaluation styles:
- Request-based: good requests divided by total requests. This is usually best for APIs because it weighs actual user experience.
- Period-based: healthy periods divided by total periods. This can fit scheduled jobs, low-volume services, or synthetic canaries.
A request-based API SLO can appear healthy during a complete outage if no one happens to call it. That is why a critical public API should also have an independent synthetic journey, such as login, submit a harmless test order in a dedicated environment or account, and verify the expected confirmation. The synthetic check does not replace real-user SLI data; it fills the no-traffic visibility gap.
3. Map each SLO to metrics, logs, and traces
Metrics tell you that reliability is deteriorating. Logs and traces help establish where and why.
A mature design uses each telemetry type for its strengths rather than expecting one tool to solve every question.
| Telemetry | Primary purpose | Examples for an order service |
|---|---|---|
| Metrics | SLI calculation, trend detection, alerting | Good/bad request counters, latency histogram, ALB 5XX count, queue age, RDS connection saturation |
| Logs | Forensic facts and searchable event evidence | Request outcome, dependency error, release version, idempotency outcome, error class, sanitized correlation ID |
| Traces | Causal path across dependencies | API gateway or service entry, risk check, order persistence, EventBridge/Kafka publish, downstream acknowledgement |
| Synthetic checks | Outside-in availability of a critical workflow | DNS, TLS, authentication, order-status journey, regional endpoint reachability |
| Business events | Correctness and completeness evidence | Orders accepted, rejected, published, consumed, reconciled, and exception counts |
Do not use CPU utilization as an SLI. CPU is a diagnostic or capacity signal, not a user outcome. It may explain a latency breach, but it cannot prove that customers were harmed.
Likewise, avoid raw log queries as the sole production SLI if a stable counter or edge metric is available. Logs can arrive late, be sampled, or vary in schema. They remain essential for evidence and investigation.
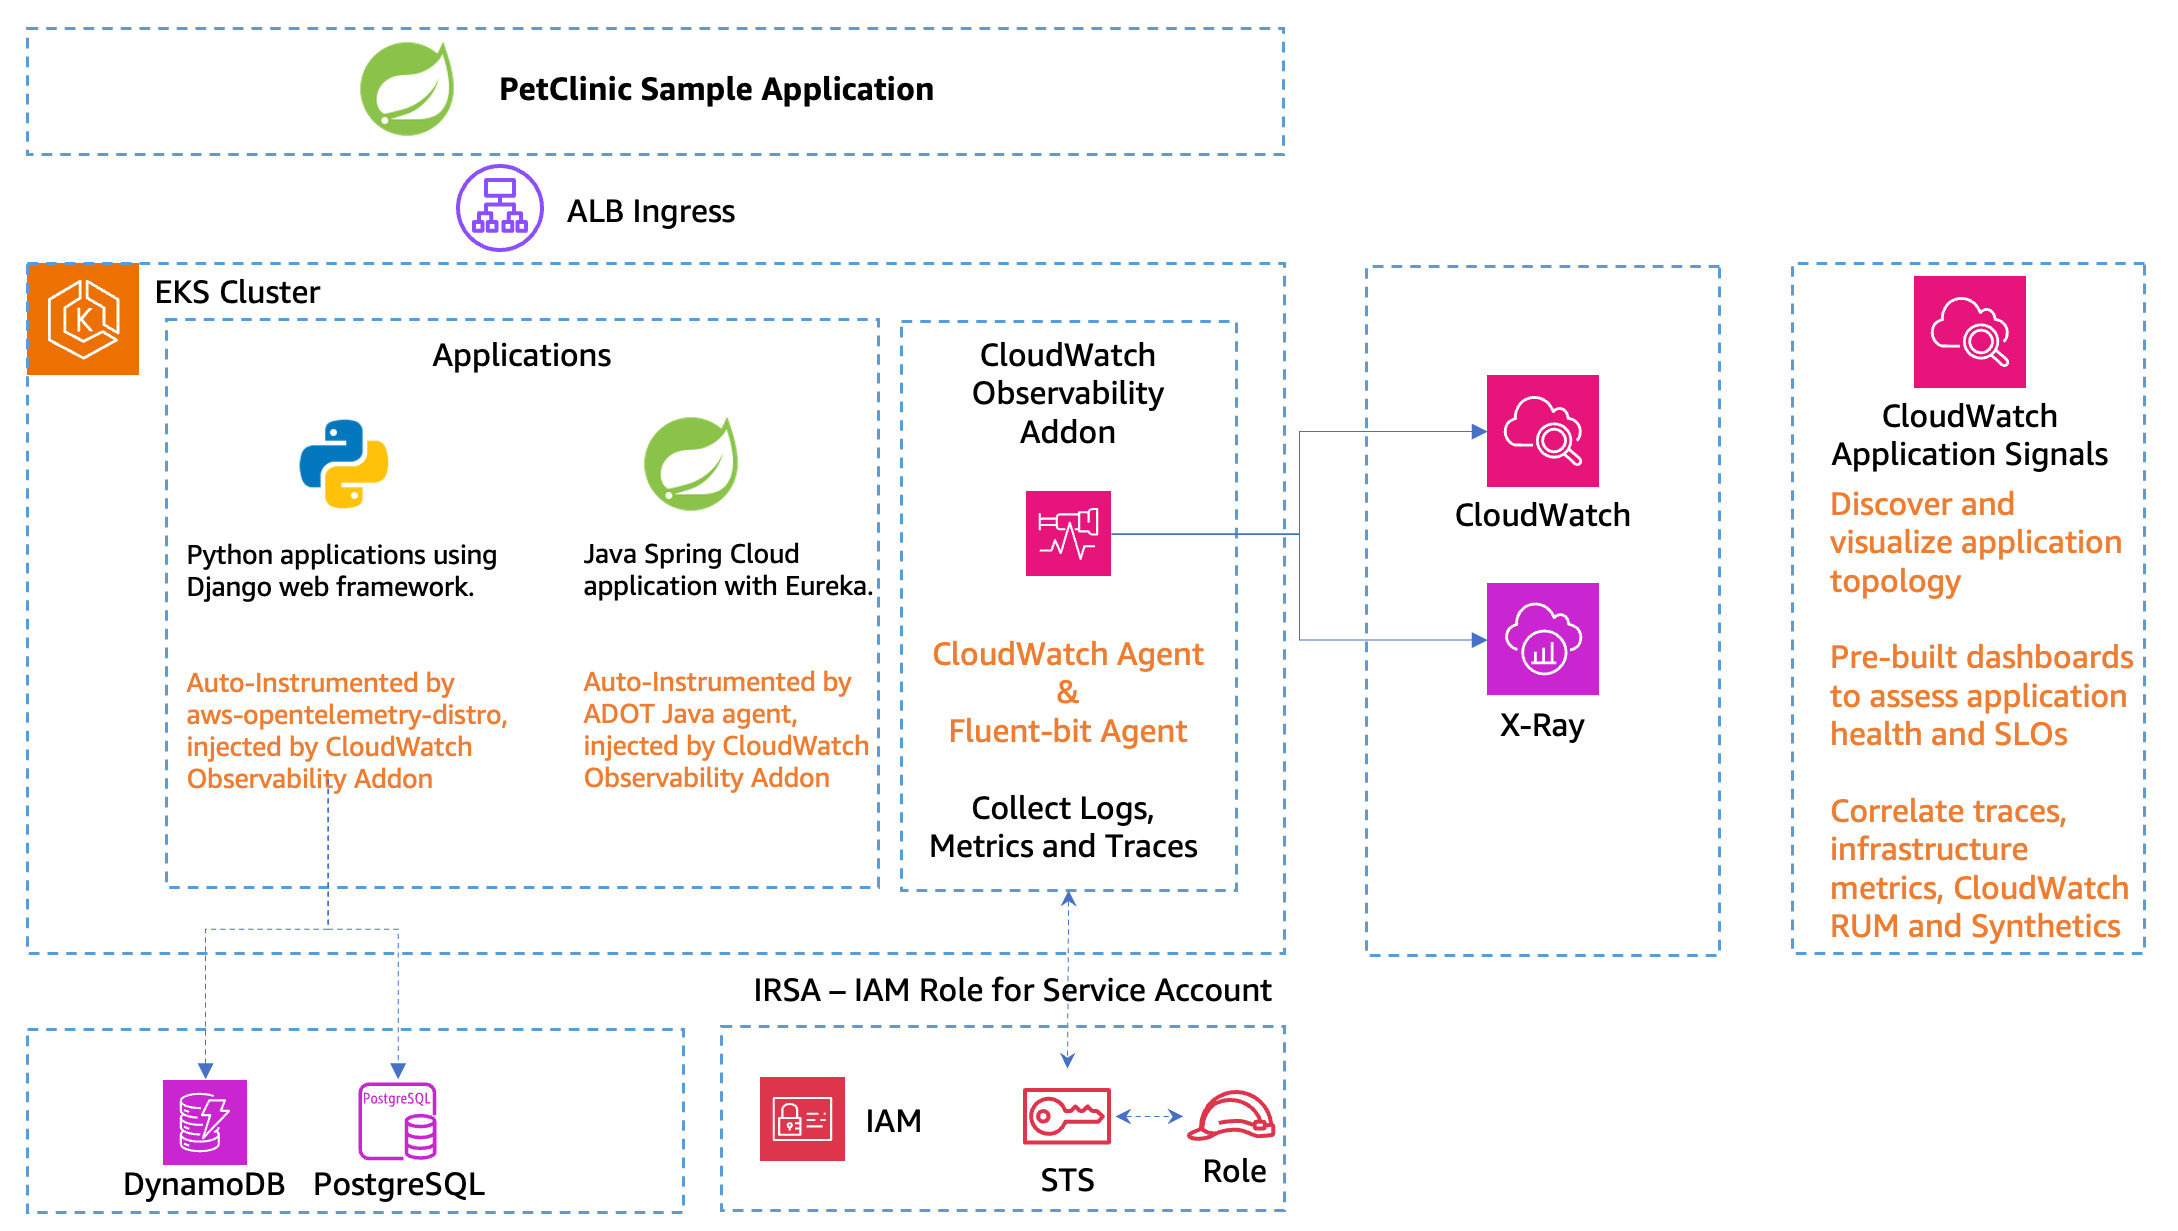
The EKS observability architecture illustrates a practical AWS pattern. Application instrumentation produces traces and application-level metrics; an observability collector or agent exports telemetry; CloudWatch and X-Ray provide correlated operational views. In an ECS implementation, the details differ, but the principle remains: the workload emits structured telemetry under a scoped IAM role, and the platform captures infrastructure and edge signals separately.
Instrument for outcomes, not only HTTP codes
For critical APIs, emit a counter with a controlled vocabulary, for example:
order_submission_total{
  outcome="accepted|business_rejected|service_error|timeout",
  route="submit_order",
  region="ap-south-1",
  deployment_version="2025.03.01"
}
Use bounded labels only. Labels such as customer_id, order_id, trace_id, or raw error messages create high-cardinality metrics, degrade Prometheus performance, and can expose sensitive information. Put request-specific identifiers in logs and traces, not metric dimensions.
A good request ratio can then be expressed conceptually as:
For a Prometheus-style implementation, it is often helpful to expose an explicit good outcome rather than recreate nuanced business logic in every dashboard query:
sum(rate(order_submission_total{outcome="good"}[5m]))
/
sum(rate(order_submission_total[5m]))
The instrumentation rule must define outcome="good" consistently. It should not merely mean “returned HTTP 2XX.”
Trace design for fast diagnosis
A trace should let an on-call engineer move from a breached SLI to the slow or failing dependency. For an order submission, useful spans might include:
- Request authentication and authorization
- Risk and limits validation
- Database write or transaction commit
- Cache access
- Event publication
- External venue or downstream adapter call, where applicable
Include deployment_version, AWS region, availability zone when useful, dependency name, sanitized error type, and retry count. Do not place account balances, credentials, personally identifiable information, or complete order details in trace attributes.
Use trace sampling deliberately. Retain errors and unusually slow traces at a higher rate than routine successful traffic. This preserves incident evidence while controlling telemetry cost.
How to Include Latency in SLO-based Alerting - Björn Rabenstein, Grafana Labs
Watch “How to Include Latency in SLO-based Alerting” from CNCF, presented by Björn Rabenstein of Grafana Labs. It gives a compact explanation of why burn-rate alerts use paired windows and why slow responses should often count as SLO failures.
Watch burn basics for the relationship among error rate, error budget, and urgent versus non-urgent action. Continue with dual windows to see why a short confirmation window lets an alert clear quickly after recovery. Then watch latency objective, focusing on the argument that a response which arrives too late is often as harmful as an explicit error.
4. Alert on budget consumption and customer symptoms
A threshold such as “page when error rate exceeds 1% for five minutes” is easy to configure but often poorly aligned with impact:
- It may page for a harmless error burst in a service with a generous SLO.
- It may miss a persistent 0.2% failure rate that will consume a strict error budget over days.
- It does not naturally tell the responder how urgent the event is.
A burn rate measures how quickly the service is consuming its permitted error rate.
For a 99.95% SLO, the permitted error rate is 0.05%.
- A burn rate of means the service is consuming budget exactly fast enough to exhaust it at the end of the SLO window.
- A burn rate below means the service is operating better than the objective requires.
- A burn rate above means the service is consuming budget too quickly.
For a 28-day rolling window, consider a fast-burn policy that pages when 2% of the total error budget would be consumed in one hour:
With a 99.95% SLO, this corresponds to an approximately 0.672% observed bad-request rate during the window:
That is materially worse than the normal 0.05% allowed error rate, and it merits immediate investigation.
Why use two windows?
A long look-back window makes alerts stable, but it remembers errors after an incident has been fixed. A short window clears quickly, but by itself can be noisy.
Pair them. For a fast-burn page, require both:
- a one-hour burn rate above 13.44; and
- a five-minute burn rate above the same threshold.
The one-hour window establishes that the event has meaningful budget impact. The five-minute window confirms the problem is still active. Once remediation works, the short window drops promptly and the page resolves, while the incident’s budget impact remains visible on the SLO dashboard.
A practical alert policy could be:
| Alert class | Example paired windows | Meaning | Response |
|---|---|---|---|
| Fast burn, page | 1 hour and 5 minutes | Severe current customer impact | Page on-call; mitigate, rollback, or reduce traffic |
| Medium burn, urgent ticket | 6 hours and 30 minutes | Persistent degradation likely to threaten the SLO | Investigate in working hours; restrict risky changes |
| Slow burn, planning signal | 3 days and 6 hours | Chronic reliability erosion | Create prioritized reliability work |
| Symptom page | No successful order submissions, or synthetic critical journey fails | A business-critical action may be unavailable, especially at low traffic | Page on-call regardless of percentage calculation |
| Capacity warning | Queue age rising, RDS connections near limit, EKS pending pods | Failure is becoming likely | Scale, shed noncritical load, or remediate before customer impact |
The last category should normally be a warning or ticket, not an automatic page. Page on customer harm, or on a leading signal with a clearly demonstrated and short path to customer harm.
Service level objectives (SLOs) - Amazon CloudWatch
Read the AWS CloudWatch documentation to connect the SLO model to Application Signals, request-based and period-based evaluation, error budgets, and native burn-rate alarms.
In “SLO concepts,” read the foundations, paying particular attention to attainment goals, periods, and rolling versus calendar intervals. Next, in “Calculate error budget and attainment,” read from “When you view information about an SLO” through the explanation of request-based SLOs; focus on why a request-based remaining budget can change as the rolling window advances. In “Calculate burn rates and optionally set burn rate alarms,” read the burn-rate interpretation, then continue through the paired multi-window alarm strategy near the end of that section.
Error-budget policy: the mechanism that makes an SLO real
Without an agreed response to budget consumption, SLOs become reporting widgets.
A workable policy for a production financial service might be:
| Budget state | Delivery and operational decision |
|---|---|
| More than 50% remaining, no concerning burn | Normal release process; approved canaries and progressive rollout continue |
| 25–50% remaining, or medium burn detected | Review recent changes and dependency health; require enhanced release review and smaller blast radius |
| Less than 25% remaining | Reliability owner reviews all planned production changes; defer high-risk feature work |
| Fast burn | Treat as an incident; stop active promotion, consider rollback or traffic controls, preserve evidence |
| Budget exhausted | Freeze non-essential feature releases for the affected service; prioritize remediation, test coverage, capacity work, or architectural fixes |
| Recovery decision | Resume normal delivery only after service health is stable and agreed corrective actions are underway |
The policy needs agreement from product, engineering, and SRE/platform leaders. That agreement is the key trade-off: the business accepts some bounded unreliability in return for feature velocity, while engineering accepts that sustained user harm changes priorities.
Do not exclude a dependency outage merely because another team owns it. The user-facing SLO should reflect the customer experience. You can separately track dependency SLIs and use service ownership to route the investigation, but customer impact should not disappear from the primary reliability picture.
5. Make dashboards useful during an incident
A dashboard should answer operational questions in a few seconds:
- Are customers currently harmed?
- How much error budget has been spent, and how quickly?
- Which operation, region, deployment, or dependency changed?
- What evidence should the responder inspect next?
For the Order API, create a dashboard with four views:
- Customer outcome: good versus bad order submissions; availability-and-latency SLI; synthetic journey status.
- SLO health: attainment, remaining budget, budget spent, and burn rate for short and long windows.
- Service diagnosis: request volume, p50/p95/p99 latency, error class, deployment version, pod or task count, saturation signals.
- Dependency health: RDS latency and connection utilization, cache errors, queue age, downstream risk-service latency, external endpoint status.
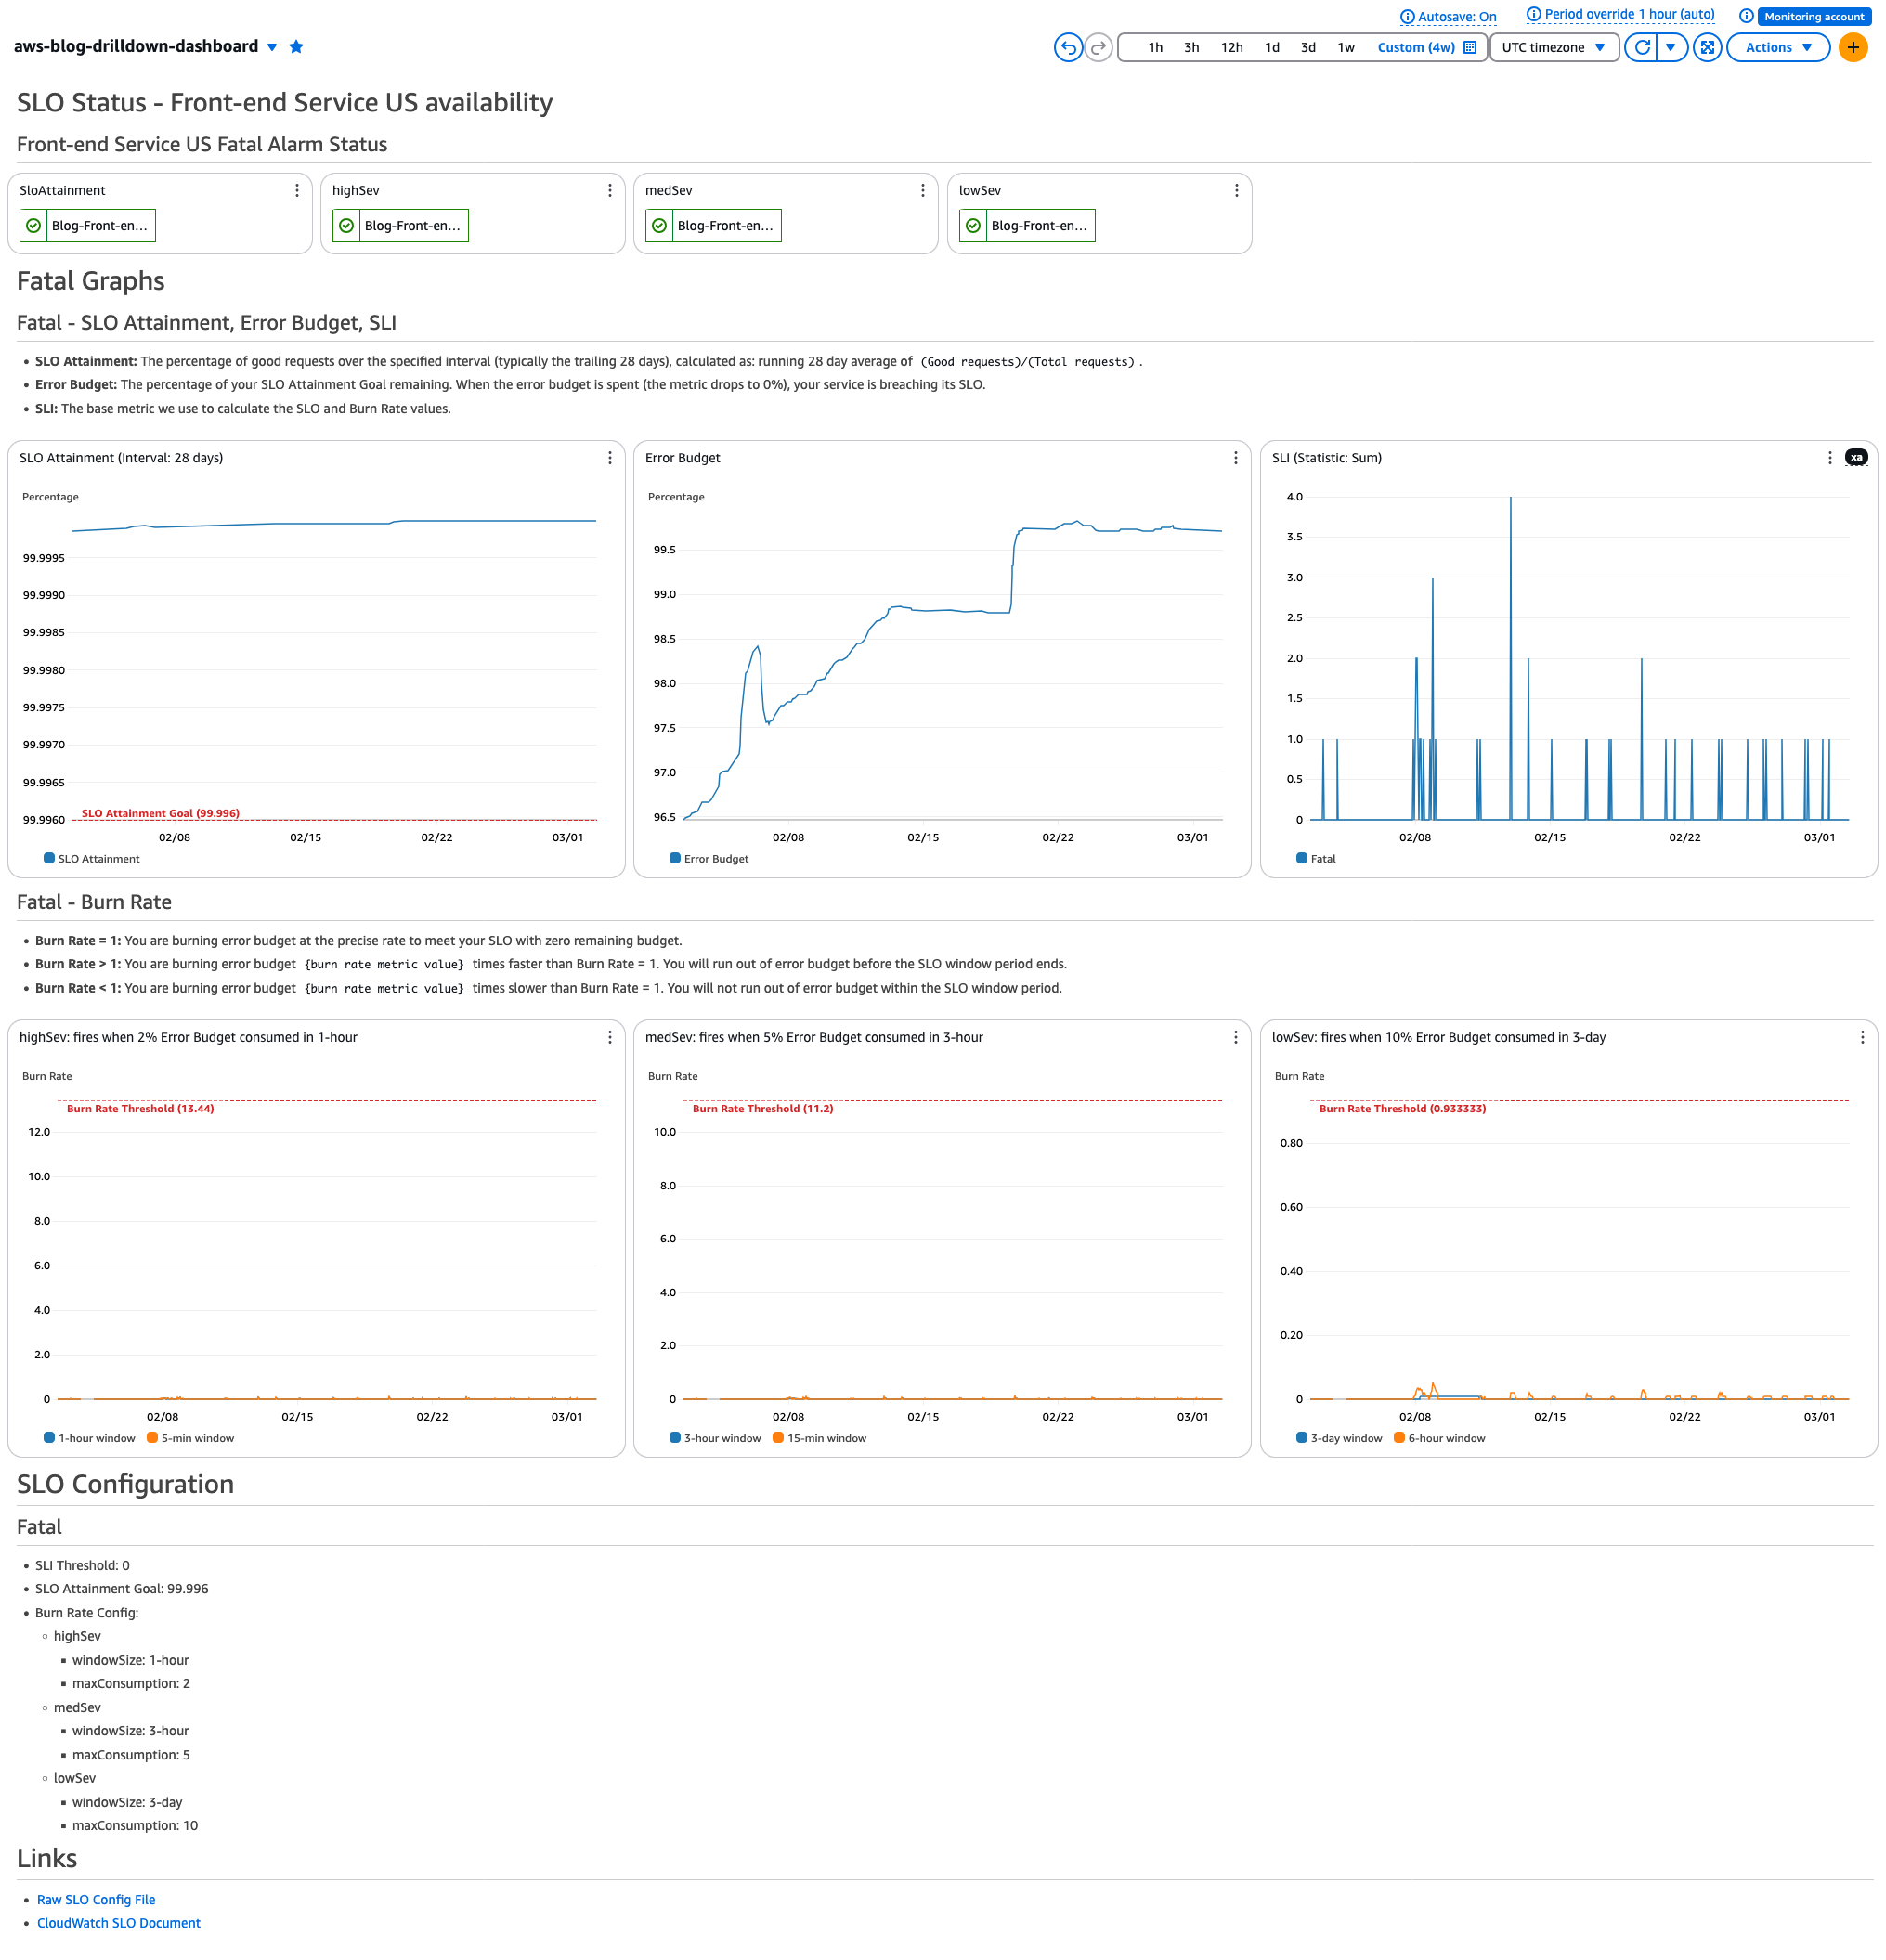
The SLO dashboard image is the executive and incident-entry view: it shows whether the objective is being met and whether budget is being consumed at a dangerous rate. It should link directly to service logs, trace search, deployment history, runbooks, and dependency dashboards. Do not make responders manually reconstruct those relationships during a live incident.
An interview-ready architecture answer
For a question such as, “How would you implement observability and SLOs for a critical AWS order service?”, a concise senior-level response is:
“I would start with critical customer journeys rather than infrastructure metrics. For order submission, I would define a request-based SLI as the proportion of eligible requests that receive a durable acceptance or valid business rejection within a stated latency threshold. I would use a rolling 28-day SLO, for example 99.95%, and document exactly how timeouts, overloads, business rejections, and 4XX responses are classified.
I would calculate the SLI from edge and application outcome metrics, use a synthetic journey to detect zero-traffic outages, and correlate the results with structured logs and OpenTelemetry traces. Metrics drive the SLO and alerting; logs provide facts such as error class, release version, and dependency failure; traces identify the slow or failing dependency.
I would page on fast multi-window burn-rate alerts and on direct customer symptoms such as a failed critical synthetic journey. I would use slower burn alerts for reliability prioritization and capacity signals as early warnings. The dashboard would show customer impact, error-budget remaining, burn rate, release changes, and dependency health.
Finally, I would agree an error-budget policy with product and engineering. When the budget is low, we reduce release risk; when it is exhausted, we pause non-essential changes and prioritize the reliability causes that consumed the budget.”
Key takeaways
- An SLI measures a customer-relevant outcome; an SLO states the target and time window; the error budget makes the allowed unreliability explicit.
- Define “good,” “bad,” and “eligible” events precisely. Do not assume that all 4XX responses are good or that all HTTP 2XX responses represent a successful customer outcome.
- For critical APIs, a combined success-and-latency SLI often gives a clearer, more actionable reliability objective than independent error and latency budgets.
- Use metrics for SLI calculation and alerting, logs for evidence, traces for dependency causality, and synthetics to cover no-traffic failures.
- Use paired short and long burn-rate windows to page for sustained, active budget consumption while allowing alerts to clear promptly after remediation.
- Error budgets must control real delivery decisions; otherwise, SLOs are only dashboards.
Next, you will apply the same outcome-driven discipline to backup and disaster recovery: separating Multi-AZ high availability from regional recovery and defending RTO and RPO choices.
Can't find a good explanation? Sign up and we'll make it for you
Sign up