
Hello! Welcome to the next lesson in your journey through advanced performance marketing.
In our last session, we focused on how to use attribution for intra-channel optimization—fine-tuning campaigns within platforms like Google and Meta Ads. We concluded that while powerful for tactics, attribution's reliance on correlation can be misleading for big-picture strategic decisions. We even touched upon Meta's new "Incremental Attribution" feature, a hint that the industry is moving towards measuring true, causal impact.
Today, we dive headfirst into that challenge. Your learning outcome is to analyze scenarios where attribution reports and incrementality tests provide conflicting signals. This is one of the most common and critical hurdles for marketing leaders. Mastering this will enable you to make smarter, more confident budget allocation decisions, justify your strategy to stakeholders, and understand the true value your marketing drives.
1. The Fundamental Conflict: Correlation vs. Causation
Before analyzing any conflicts, we must be crystal clear on why they happen. Attribution and incrementality are not just different reports; they are designed to answer fundamentally different business questions.
- Attribution asks: "Which marketing touchpoints were part of the journey for users who converted?" It's a correlational tool that helps map the observed path to purchase.
- Incrementality asks: "How many conversions happened because of the marketing touchpoint that would not have happened otherwise?" It's a causal tool that measures true lift.
This distinction is the source of all conflict between the two. Attribution models, even sophisticated data-driven ones, can give credit to touchpoints that didn't actually cause the conversion. They simply happened to be there.
To refresh this crucial concept, let's watch a short video that breaks down the basics of incrementality testing.
Incrementality Testing in Digital Marketing & testing architecture
The video 'Incrementality Testing in Digital Marketing' from the Senator We Run Ads channel offers a concise explanation of what incrementality is and how a basic test is structured. It sets the foundation for understanding how it differs from attribution.
Please watch from 01:10 to 03:32. Focus on the core question incrementality answers ('would they have happened anyways?') and how the control/test group setup is used to calculate the true number of incremental leads.
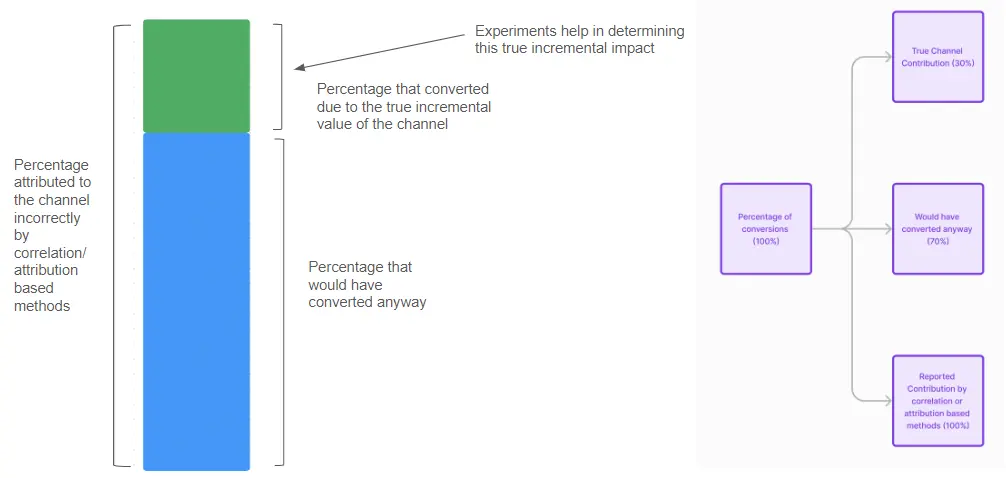
The video shows that some conversions in the "test" group would have happened anyway, as proven by the conversions that occurred in the "control" group (which saw no ads). Incrementality isolates the additional conversions driven by the ads.
This image provides a simple, powerful visualization of the concept:
2. Why Contradictions Are Normal and Expected
Given that these tools measure different things, it's not just possible but expected that their outputs will differ. As a leader, your role isn't to be alarmed by these contradictions but to see them as opportunities for deeper insight.
Bridging Contradictions in Measurement Data: MTA vs. ...
The article 'Bridging Contradictions in Measurement Data' from Rockerbox provides a great strategic framing for this topic. It explains why discrepancies are inevitable and how to think about them.
Please read the introduction and the section 'Why Contradictions Arise.' This will reinforce the core reasons for the discrepancies we're discussing.
As the article notes, the key reasons for conflicting signals are differences in:
- Assumptions: Attribution assumes correlation is meaningful; incrementality tests for causation.
- Data Sources: Attribution relies on tracked user-level data (clicks, views), which can be incomplete. Incrementality often uses aggregated data (e.g., total sales in a geographic region).
- Timeframes: Attribution often uses short lookback windows (e.g., 7-30 days), while incrementality can measure impact over a specific test period.
Now, let's look at two classic scenarios where these differences lead to conflicting signals.
3. Common Scenarios and How to Analyze Them
Your experience with Google and Meta Ads makes you perfectly positioned to understand these common situations.
Scenario 1: High Attributed ROAS, Low Incrementality
This is the most frequent conflict. A channel or campaign looks like a top performer in your attribution reports, but an incrementality test shows it has little to no causal impact.
- Classic Examples: Branded Search, Retargeting campaigns.
- Why it Happens: These channels are brilliant at harvesting existing intent, not creating it. A user who is already determined to buy from you will likely search for your brand name or be in a retargeting audience. An attribution model sees the ad, sees the conversion, and connects the two. An incrementality test, however, would show that if you turned off those ads (for a control group), most of those users would have converted anyway. They are capturing value, not creating it.
- Your Analysis: When you see this, the channel isn't necessarily "bad," but its role is different from what attribution suggests. It's a defensive or closing channel. The question for you as a leader is not "should we turn it off?" but rather "are we paying too much to capture demand that was already ours?" The platform-reported ROAS is likely inflated.
Scenario 2: Low Attributed ROAS, High Incrementality
This scenario is more subtle but strategically vital. A channel has a poor ROAS in your attribution reports, making it a candidate for budget cuts, yet an incrementality test reveals it's a major driver of business value.
- Classic Examples: Upper-funnel YouTube campaigns, Display prospecting, TV ads.
- Why it Happens: Attribution models struggle to connect the dots when the journey is long, crosses multiple devices, or involves offline influence. A user might see a YouTube ad on their TV, get interested, research on their phone later, and finally purchase on their laptop. A standard attribution model will likely miss the initial YouTube touchpoint entirely and give all credit to the final click (e.g., a search ad). An incrementality test (like a geo-lift test) compares sales in a region that saw the campaign to a control region that didn't, capturing the full causal impact regardless of the messy user journey.
- Your Analysis: This conflict signals that your attribution model is undervaluing a channel's demand-creation capabilities. Pausing this channel based on its poor attributed ROAS could silently kill the top of your funnel, leading to a decline in overall sales down the line.
4. Strategic Resolution: From Conflict to Clarity
Knowing why conflicts happen is only half the battle. Your primary role is to decide what to do. The goal is not to prove one tool "right" and the other "wrong," but to synthesize their insights into a more robust strategy.
The most effective approach is to use the two methodologies to establish upper and lower bounds for a channel's performance.
- Attributed ROAS: Represents the optimistic upper bound. It shows the total value of all journeys the channel touched.
- Incremental ROAS (iROAS): Represents the conservative, causal lower bound. It shows the value the channel truly created.
Your true ROAS lies somewhere in between. This framework alone is a huge step up in strategic maturity. But we can go further by using the lower bound to "correct" the upper bound. This is called calibration.
For pub on TwG _ [External Playbook] Modern Measurement
The 'Modern Measurement' playbook from Think with Google provides an excellent, practical method for resolving these conflicts using a calibration multiplier. This is a key technique for turning conflicting data into an actionable financial strategy.
Please read the sections titled 'How to deal with discrepancies' and '[Intermediate and advanced stage] Calibrate attribution results based on incrementality experiments'. Pay close attention to the table showing how the 'Calibration Multiplier' is calculated and applied.
The Calibration Multiplier in Practice
Let's walk through the example from the guide.
- Run an Incrementality Test: You run a geo-lift experiment on your "Channel 1" campaign and find its iROAS is $3.5.
- Pull Attributed Data: During the same period, your attribution model (e.g., GA4 DDA) reports that "Channel 1" had an Attributed ROAS of $5.0.
- Calculate the Calibration Multiplier: This multiplier tells you that for every dollar of ROAS your attribution model reports, the true, incremental ROAS is only 70 cents.
- Apply the Multiplier for Ongoing decisions: Now, in the next quarter, you don't need to run another expensive test immediately. If your attribution report shows a ROAS of $4.5 for that channel, you can calculate an estimated iROAS:
This calibrated number is a much more realistic figure to use for strategic budget allocation and to compare against other channels that have also been calibrated. It allows you to use the speed of attribution with the accuracy of incrementality.
Test your understanding!
You are presented with the following Q3 data for two channels:
| Channel | Attributed ROAS (from GA4) | Incremental ROAS (from Lift Test) |
|---|---|---|
| Meta Retargeting | $12.0 | $3.0 |
| YouTube Prospecting | $2.5 | $2.0 |
Your team lead, relying on the platform-reported ROAS, argues for shifting more budget into Meta Retargeting because its attributed ROAS is nearly 5x that of YouTube.
How would you analyze this scenario and what would your strategic recommendation be?
Show answer
-
Analysis: This is a classic conflict scenario.
- Meta Retargeting shows high attributed ROAS but low incrementality. Its calibration multiplier is $3.0 / $12.0 = 0.25. This means it's only generating 25% of the value attributed to it; the rest is from users who would have converted anyway.
- YouTube Prospecting shows low attributed ROAS but high incrementality. Its calibration multiplier is $2.0 / $2.5 = 0.80. This channel is highly causal, with 80% of its attributed value being truly incremental.
-
Strategic Recommendation: The team lead's conclusion is incorrect because it compares an inflated, correlational metric (Meta's $12 ROAS) with a less inflated one. The truly more efficient channel for driving new business is YouTube Prospecting ($2.0 iROAS vs. $3.0 iROAS is closer, but YouTube is creating demand while Meta is mostly harvesting).
- Shifting budget away from YouTube and into Meta would be a strategic mistake. It would defund the demand creation engine and overfund the demand harvesting mechanism, likely leading to a long-term decline in performance.
- The correct action is to use the calibrated understanding to value each channel properly. You might even consider testing a budget increase for YouTube, as it is proving to be a highly incremental channel.
Conclusion
Navigating the conflicting signals from attribution and incrementality is a hallmark of a sophisticated marketing leader. By understanding that these conflicts are natural and informative, you can move beyond surface-level metrics to a deeper, more causal understanding of your marketing's impact.
Key Takeaways:
- Conflicts between attribution and incrementality are expected because they answer different questions: attribution finds correlation, while incrementality proves causation.
- Analyze conflicting scenarios by identifying the channel's role: Is it creating new demand (potentially low attribution, high incrementality) or harvesting existing intent (potentially high attribution, low incrementality)?
- Don't discard either tool. Use them together to establish performance bounds: attribution as the optimistic upper bound and incrementality as the causal lower bound.
- Use calibration multipliers (iROAS / Attributed ROAS) to adjust your real-time attribution data, giving you a more accurate estimate of true impact for day-to-day decision-making.
Preview of the Next Lesson:
Today, we learned how to analyze and reconcile conflicts between attribution and incrementality. The logical next step is to formalize how they coexist in your measurement strategy. In the next lesson, we will develop a hybrid measurement framework that defines the roles for both attribution and incrementality, ensuring each tool is used where it adds the most value.