
Hello! Welcome back to our final module, System Design & Production Readiness.
In our previous lessons, we explored how components like API Gateways and Service Meshes are instrumental in making our systems observable. We learned that they help generate and manage the three pillars of observability: metrics, logs, and traces.
Today, we're moving from theory to practice. It's one thing to collect this data; it's another entirely to use it under pressure to solve a production issue. This lesson is designed to prepare you for a common and critical interview scenario: troubleshooting a live system. The learning outcome is to analyze the root cause of a simulated production incident by correlating logs, metrics, and traces. We will walk through a methodical, detective-like process that senior engineers use to quickly diagnose and resolve problems in complex distributed systems.
The Three Pillars of Incident Investigation
When an incident occurs, we rely on the three pillars of observability to answer progressively deeper questions. These pillars are not independent; their real power comes from their correlation.
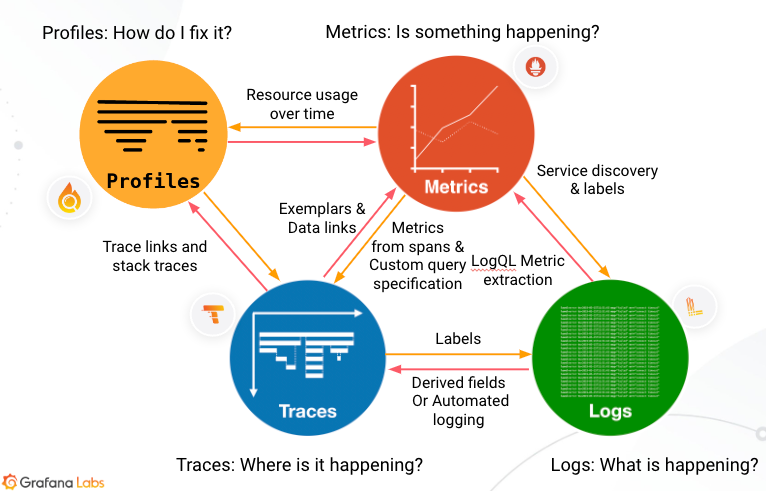
This structured approach—from "what" to "where" to "why"—is the foundation of efficient troubleshooting and the core of this lesson.
The Anatomy of an Incident: A Step-by-Step Analysis
Imagine this scenario, a classic interview prompt:
It's 2 PM on a Tuesday. You are on-call. An alert fires from Prometheus:
P95 Latency for checkout-service has exceeded the 5-second SLO. Simultaneously, customer support reports a spike in checkout failures. What do you do?
A panicked, unstructured response involves randomly SSH-ing into machines and tail-ing log files. A senior engineer, however, follows a calm, methodical process.
Let's explore this workflow. For a practical overview of how the different data sources are collected and integrated in a Spring Boot environment, you can refer to the "Spring Boot 3 Observability with Grafana Stack" video by Programming Techie, which we'll draw upon.
Mastering Observability in Spring Boot Microservices
Before we walk through our incident, let's start with a compelling article that frames the problem and outlines the solution. It discusses the chaos of an un-observable system and presents a clear workflow for incident response.
Please read the 'Problem Statement: When Microservices Go Dark' section to set the stage. Then, review the 'Team Workflows Matter More Than Tools' section, paying close attention to the incident response flowchart. This flowchart is the exact mental model we will be following.
As the article's flowchart suggests, our investigation follows a clear path:
- Alert & Triage (Metrics): What is happening?
- Isolate & Pinpoint (Traces): Where is it happening?
- Root Cause Analysis (Logs): Why is it happening?
Step 1: From Alert to Metrics (The "What")
The alert tells you something is wrong, but it lacks detail. Your first step is to go to your monitoring dashboard (e.g., Grafana) to understand the scope and nature of the problem.
You would look at the "Golden Signals" for the checkout-service:
- Latency: The alert is confirmed. You see P95 and P99 latency spiking dramatically.
- Traffic: Is there a sudden surge in requests that could be causing the slowdown? Let's assume traffic is normal.
- Errors: Is the error rate (
5xxstatus codes) increasing along with latency? Yes, it is. - Saturation: Is the service's CPU, memory, or connection pool usage maxed out?
At this point, you've confirmed the incident and characterized it: The checkout-service is experiencing high latency and an increased error rate under normal traffic loads. The metrics tell you what is happening, but not why.
Correlate Your Metrics, Logs & Traces with the curated OSS observability stack from Grafana Labs
This short clip from Grafana demonstrates this first step. It shows an engineer noticing a spike in 500 errors in Prometheus metrics and then preparing to dig deeper.
Watch the segment from 00:26 to 01:10. Notice how the engineer starts with metrics in a dashboard to confirm the problem before moving to the next step of investigating logs.
Step 2: From Metrics to Traces (The "Where")
Now that you know what is happening, you need to find out where the latency is being introduced. This is the superpower of distributed tracing. A single request to the checkout-service might involve calls to user-service, inventory-service, and payment-service. A trace will show you the entire journey.
Your next action is to find a trace for a slow or failed checkout request. You can do this in a few ways:
- Using Exemplars: Modern monitoring tools link metrics directly to traces. In Grafana, you might see a diamond icon on your latency graph. Clicking it takes you directly to a trace that occurred during that time spike.
- Manual Search: In your tracing tool (e.g., Jaeger, Grafana Tempo), you can search for traces from the
checkout-servicearound the time of the incident, filtering for those with anerror=truetag or a duration greater than 5 seconds.
You find a trace and open the waterfall view. It looks something like this:
checkout-service (8.2s total)
├── user-service (50ms)           ✓
├── inventory-service (7.8s)      ❌
│   ├── check-stock (7.7s)        ❌
│   └── reserve-stock (100ms)     ✓
├── payment-service (300ms)       ✓
└── create-order (50ms)           ✓
The trace immediately exonerates the user-service and payment-service. The problem is clearly localized: the call from checkout-service to inventory-service, and specifically within the check-stock operation, is taking almost 8 seconds.
You now know where the problem is.
Test your understanding!
In the trace above, if the inventory-service team claims their service is fine because its own latency dashboard looks normal, how could you use the trace to facilitate the conversation?
Show answer
This is a classic "it's not my service" scenario that distributed tracing solves. I would share the trace ID with the inventory-service team. The trace is objective proof that from the perspective of a specific user request, their service took 7.8 seconds to respond.
The trace allows you to say: "I'm not claiming your entire service is down. However, for trace abc-123, which started at 14:02:15 UTC, the call to your check-stock operation took 7.7 seconds. Can you please investigate what your service was doing for this specific request?" This shifts the conversation from blame to collaborative, data-driven problem-solving.
Step 3: From Traces to Logs (The "Why")
You've pinpointed the problem to the inventory-service. Now you need the "smoking gun"—the specific error message that explains why it's slow. This is where logs come in, and the correlation ID (Trace ID) is your key.
Your final step:
- Copy the Trace ID from the trace view.
- Go to your centralized logging platform (e.g., Grafana Loki, ELK Stack).
- Search for all logs that match that specific Trace ID, filtering for
service=inventory-service.
Instead of sifting through millions of log lines from all services, you are now looking at the handful of logs from the inventory-service that are relevant to that single, failed request.
You find the following log entry:
{
  "timestamp": "2023-10-27T14:02:22.850Z",
  "level": "ERROR",
  "thread": "task-executor-42",
  "logger": "com.example.inventory.DatabaseAccessor",
  "service": "inventory-service",
  "traceId": "abc-123",
  "spanId": "def-456",
  "message": "Failed to execute database query for product check",
  "stack_trace": "java.sql.SQLTransientConnectionException: hikari-pool-1 - Connection is not available, request timed out after 7700ms."
}
This is the root cause. The inventory-service couldn't get a connection from its database connection pool (HikariCP), and it timed out after waiting 7.7 seconds. The problem isn't a slow query; the service is completely starved for database connections. The fix might be to increase the pool size, fix a connection leak, or scale the database.
Spring Boot 3 Observability with Grafana Stack
Let's watch this entire correlation workflow in action. This video demonstrates moving seamlessly between metrics, traces, and logs within Grafana to diagnose an issue.
Please watch the segment from 36:16 to 41:27. The presenter uses Grafana to: View logs in Loki. View metrics in Prometheus. Find a Trace ID from the logs and use it in Tempo to visualize the distributed trace, including database calls. This is a perfect demonstration of the workflow we've just discussed.
Conclusion: Your Interview-Ready Answer
By following this structured methodology, you've gone from a vague alert to a precise root cause in minutes, not hours. Let's summarize the key takeaways that form a compelling answer to an interview question about debugging a production issue.
- Systematic Approach: Incident analysis is a systematic process of narrowing down possibilities. Start broad with metrics (what), then focus with traces (where), and finally, get the details with logs (why).
- Correlation is Key: The true power of modern observability is not in the individual signals, but in their correlation. A consistent
traceIdpropagated across all services and attached to every metric, log, and span is non-negotiable in a microservices architecture. - Data-Driven Collaboration: This process removes guesswork and blame. When you can present a trace and correlated logs, it facilitates a productive, evidence-based conversation between teams to solve the problem quickly.
The "Debugging War Stories" in the "Mastering Observability" article (section 10) provide excellent, concise examples of this process in action, which you can use to enrich your interview answers.
Preview of the Next Lesson:
In this lesson, we focused on the reactive process of responding to an incident. In our next lesson, we will shift to a more proactive stance. We'll learn how to describe a holistic observability strategy for production, incorporating centralized logging, metrics, alerting, and tracing. We'll discuss how to define what's worth monitoring and how to set up your systems for health and performance visibility before an incident ever happens.
Can't find a good explanation? Sign up and we'll make it for you
Sign up