
Hello! Welcome to the final module of our course, System Design & Production Readiness.
In our last lesson, we put on our detective hats and learned how to react to a production incident by correlating metrics, traces, and logs to find the root cause. That reactive capability is essential, but it's only half the story. A world-class engineering team doesn't just solve fires; it builds a fireproof system.
Today, we shift from a reactive to a proactive mindset. Our goal is to answer a classic senior-level system design question: How do you design a holistic observability strategy for a production microservices environment? We will architect a complete, end-to-end solution that incorporates centralized logging, metrics, alerting, and tracing. This isn't just about connecting tools; it's about building a cohesive system that provides deep insights into your application's health and performance before an incident even occurs.
The Foundation: A Unified Strategy
A "holistic" strategy means that all the pieces work together seamlessly. The chaos of separate, un-correlated systems for logs, metrics, and traces is a common anti-pattern. A modern observability platform is built on two foundational principles:
- Standardization: Using a single, vendor-neutral framework to generate and collect telemetry data. Today, that standard is OpenTelemetry (OTel). It provides a set of APIs and SDKs to instrument your code once and send the data to any compatible backend.
- Correlation: Ensuring every piece of telemetry data (a log line, a metric data point, a trace span) related to a single request can be linked together. As we saw in the last lesson, the Trace ID is the golden thread that ties everything together. Enforcing its propagation across all services is a primary design goal.
The Four Pillars of a Holistic Strategy
Our strategy will be built upon four pillars. We'll define the goal for each, the tools we'll use, and the key best practices you should highlight in an interview.
First, let's get acquainted with the open-source tools that form the backbone of many modern observability stacks.
Open Source Observability Explained - The Grafana Stack
The video 'Open Source Observability Explained - The Grafana Stack' provides an excellent overview of the purpose-built databases for each type of telemetry signal. Understanding why these specialized tools exist is key to justifying your architectural choices.
Please watch the sections explaining Logs (Loki), Metrics (Prometheus/Mimir), and Traces (Tempo). Focus on the core problem each tool is designed to solve. Logs with Loki (02:24 - 04:16): Note its cost-effective approach of indexing only metadata. Metrics with Prometheus & Mimir (04:16 - 06:26): Understand Prometheus's role and how Mimir adds long-term storage and scalability. Traces with Tempo (06:26 - 08:00): Grasp why tracing is ideal for deep-diving into the path of a single request.
Now that you have an overview of the backend components, let's design the strategy for each pillar, from the application code all the way to the backend.
Pillar 1: Centralized Logging
- Goal: To aggregate logs from all microservices into a single, searchable, and machine-readable format.
- Strategy & Best Practices:
- Structured Logging: All logs must be emitted as JSON objects, not plain text. This allows for powerful filtering and analysis (e.g.,
level=ERROR AND service=payment-service). In Spring Boot, this is easily achieved with a library likelogstash-logback-encoder. - Essential Fields: Every log entry must contain a standard set of fields:
timestamp,level,service_name,thread,message, and most importantly, thetraceIdandspanIdfor correlation. - Data Sanitization: Never log sensitive user data (PII) or secrets. Implement logging filters or custom annotations to mask or omit this data before it ever leaves the application.
- Centralization: Logs are collected by an agent (like the OTel Collector, Fluentd, or Promtail) and shipped to a central log aggregation system like Grafana Loki or the ELK Stack. Loki's approach, which only indexes metadata labels (like
service,host,level), is often more cost-efficient for high-volume logs than Elasticsearch's full-text indexing.
- Structured Logging: All logs must be emitted as JSON objects, not plain text. This allows for powerful filtering and analysis (e.g.,
The article "Mastering Observability in Spring Boot Microservices" provides a great example of configuring logback-spring.xml for structured JSON logging.
Pillar 2: Meaningful Metrics
- Goal: To gain a quantitative, real-time understanding of system health and business performance.
- Strategy & Best Practices:
- The Golden Signals Framework: For every service and every public endpoint, monitor the "Golden Signals":
- Latency: How long do requests take? (e.g., P95, P99 response time).
- Traffic: How much demand is on the service? (e.g., requests per second).
- Errors: What is the rate of failed requests? (e.g., HTTP 5xx error rate).
- Saturation: How "full" is the service? (e.g., CPU utilization, connection pool usage, queue depth).
- Business-First Metrics: Technical metrics are for engineers, but business metrics get buy-in from the entire organization. Instrument critical business flows. Instead of just
http_requests_total, create custom metrics likeorders_processed_total,payment_failures_total, oruser_registrations_total. This directly connects system performance to business outcomes. - Tooling: Use Micrometer in Spring Boot to instrument the application. Metrics are exposed via an endpoint (e.g.,
/actuator/prometheus), which is then scraped by a Prometheus server. For production scale, you'll need a long-term storage solution like Grafana Mimir or Thanos for durability and global querying.
- The Golden Signals Framework: For every service and every public endpoint, monitor the "Golden Signals":
Mastering Observability in Spring Boot Microservices
The 'Mastering Observability' article emphasizes the importance of focusing on the right metrics. This is a key insight for senior-level interviews.
Please read the sections 'Lessons Learned: 1. Start with Business Metrics, Not Technical Metrics' and '6. The “Golden Signals” Framework Works'. These sections provide concrete examples and justification for prioritizing certain types of metrics.
Pillar 3: Distributed Tracing
- Goal: To trace the end-to-end journey of a request as it travels through multiple services, making it easy to pinpoint bottlenecks and error sources.
- Strategy & Best Practices:
- Automatic Instrumentation: Leverage Spring Boot's built-in observability and the OpenTelemetry starter to automatically instrument incoming/outgoing HTTP requests, database calls, and message queue interactions. This provides a rich trace without cluttering your business logic.
- Sampling Strategy: In a high-traffic production system, tracing every single request is prohibitively expensive. You must have a sampling strategy.
- Head-based sampling: A decision is made at the beginning of the trace (e.g., trace 1% of all requests). It's simple but may miss rare errors.
- Tail-based sampling: The decision is made at the end of the trace. This allows you to keep 100% of "interesting" traces (e.g., those with errors or high latency) while discarding most of the routine ones. This is more complex but far more effective for debugging.
- Tooling: Traces are sent from the application (often via an OTel Collector) to a tracing backend like Jaeger or Grafana Tempo.
The following video shows how simple it has become to set up a full observability stack, including tracing, with modern Spring Boot.
Spring Boot 4 OpenTelemetry: From Zero to Full Observability in Minutes
The video 'Spring Boot 4 OpenTelemetry: From Zero to Full Observability in Minutes' demonstrates the power of the new OpenTelemetry starter and Docker Compose integration in Spring Boot. It shows how you can get a complete LGTM (Loki, Grafana, Tempo, Mimir) stack running with minimal configuration.
Watch the following segments to see the holistic strategy in practice: Introduction (00:24 - 01:37): Understand the role of the new OTel starter. Project Setup (02:28 - 07:00): Note how selecting the OpenTelemetry and Docker Compose dependencies automatically provisions the entire backend stack (LGTM). Visualizing Traces (10:54 - 13:49): See how a request is visualized in Grafana Tempo, showing the power of distributed tracing.
Pillar 4: Intelligent Alerting
- Goal: To proactively notify engineers of actual or impending user-facing issues, without creating "alert fatigue."
- Strategy & Best Practices:
- Alert on Symptoms, Not Causes: Alert when user experience is degraded (symptom), not on internal conditions (cause). For example, alert on
High P99 LatencyorHigh Error Rate, notHigh CPU Usage(unless CPU usage is a direct measure of saturation that precedes a failure). - SLO-Based Alerting: Define and alert on Service Level Objectives (SLOs). An SLO is a precise target for a metric, like "99.9% of home page requests over the last 28 days must be served in under 300ms." Alerts should fire when you are in danger of violating your SLO.
- Actionable Alerts & Runbooks: Every alert must be actionable. If an engineer doesn't know what to do when an alert fires, the alert is useless noise. Each alert must be linked to a runbook that details investigation steps and mitigation procedures.
- Tooling: Prometheus Alertmanager is the standard tool. It handles deduplication, grouping, and routing of alerts to destinations like PagerDuty, Slack, or email.
- Alert on Symptoms, Not Causes: Alert when user experience is degraded (symptom), not on internal conditions (cause). For example, alert on
Test your understanding!
You are designing an alert for a payment-service. Which of the following is a better alert, and why?
ALERT HighCPU ON payment-service IF cpu_usage > 90% FOR 5mALERT PaymentSuccessRateLow ON payment-service IF slo:payment_success:rate_1h < 0.995 FOR 10m
Show answer
The second alert is far better. It's a symptom-based, SLO-driven alert that directly reflects user impact. A low payment success rate means the business is losing money and customers are frustrated. It is unambiguously critical.
The first alert is a cause-based alert. High CPU might be perfectly normal during a batch job, or it might be a symptom of a problem. It lacks context and can lead to false alarms and alert fatigue. The PaymentSuccessRateLow alert tells you that something is wrong; you would then use metrics, traces, and logs to investigate if high CPU is the cause.
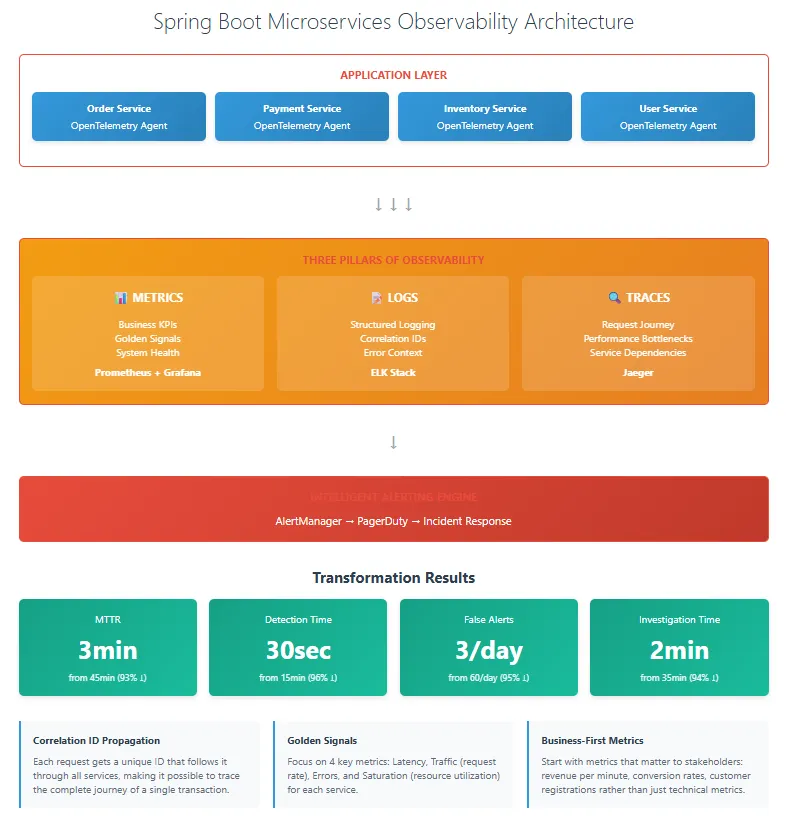
The Holistic Architecture
When you put all these pillars together, you get a comprehensive, production-ready observability architecture.
Conclusion
Designing a holistic observability strategy isn't just about picking tools; it's about establishing a culture of proactive monitoring and data-driven decision-making. In an interview, describing this strategy demonstrates your understanding of what it takes to run reliable systems at scale.
Key Takeaways for Your Interview:
- Start with Standardization: Propose OpenTelemetry as the foundation for collecting telemetry to ensure consistency and avoid vendor lock-in.
- Emphasize Correlation: State that a non-negotiable principle is the propagation of a Trace ID across all services and its inclusion in all logs, metrics, and traces.
- Structure around Pillars: Clearly articulate your strategy for each of the four pillars: structured logging, Golden Signals and business metrics, sampled tracing, and SLO-based alerting.
- Justify Your Tooling: Explain why you'd choose purpose-built backends like Loki, Mimir, and Tempo.
- Focus on Actionability: Conclude by highlighting that the ultimate goal is not just data collection, but enabling rapid, data-driven incident response through actionable alerts and unified visualization. The "Production Deployment Checklist" in the "Mastering Observability" article provides an excellent summary of the steps to make this a reality.
Preview of the Next Lesson:
We have now covered how to design a system for visibility and how to react when that system tells you something is wrong. In our final lesson, we'll address the ultimate "what if": disaster recovery. We'll discuss strategies for ensuring business continuity when entire components, data centers, or regions fail.
Can't find a good explanation? Sign up and we'll make it for you
Sign up