
Hello! Welcome back to our series on advanced performance marketing.
In our last lesson, we focused on building a clear strategic plan by translating high-level business objectives into a hierarchy of marketing KPIs using tools like the KPI Pyramid and KPI Tree. This gives you a logical, clean map for how your team's activities drive business results.
However, the real world of data is rarely that clean. The numbers you plug into your beautiful KPI trees are often estimates, subject to noise, and based on incomplete information. A critical skill for any marketing leader is not just to understand this uncertainty, but to communicate it clearly and effectively to stakeholders who may not have a statistical background.
This lesson directly addresses the learning outcome: Communicate data limitations and confidence levels effectively to non-technical stakeholders. We will cover how to identify and talk about what your data can't tell you, and how to use confidence intervals to express your level of certainty about what it can tell you. Mastering this will help you build credibility, manage expectations, and guide your organization toward making smarter, more resilient decisions.
1. The Foundation of Trust: Acknowledging Data's Limits
Before you present any numbers, especially to senior leaders, it's crucial to be transparent about the potential weaknesses or blind spots in your data. This isn't a sign of failure; it's a sign of intellectual honesty and builds trust. Presenting data as flawless when it's not is a sure way to lose credibility when reality doesn't match the report.
Data limitations can come in many forms. This image provides an excellent framework for categorizing them.
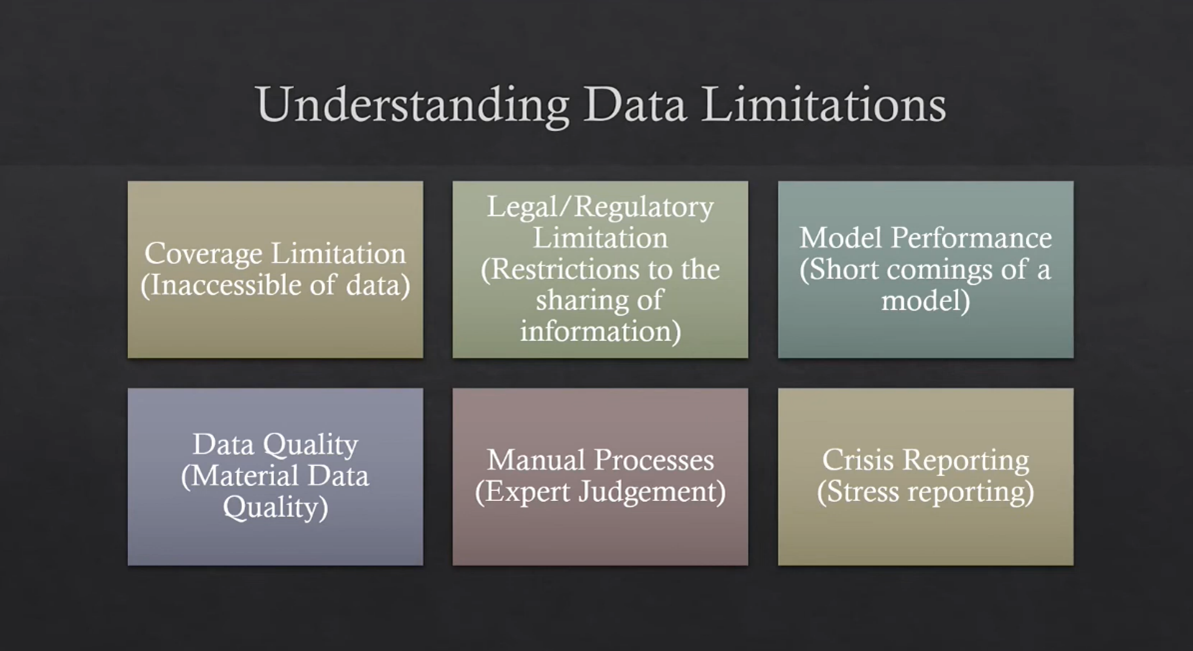
Let's briefly touch on each category with a marketing example relevant to your experience:
- Coverage Limitation: You have detailed clickstream data for your website, but you have no data on why a user chose a competitor's product instead. Your data only covers a part of the customer's journey.
- Legal/Regulatory Limitation: Due to GDPR or other privacy regulations, you cannot personally identify users who performed certain actions, limiting your ability to do deep individual-level analysis.
- Model Performance: A predictive LTV model you use might be highly accurate for customers from mature channels like Google Search, but perform poorly for newer channels like TikTok due to a lack of historical data.
- Data Quality: Incorrect UTM tagging on a major campaign means you can't reliably attribute a spike in traffic to the right source. The data is present, but dirty.
- Manual Processes: Your team's weekly performance summary relies on an analyst's "expert judgment" to manually classify certain types of conversions because the process isn't fully automated.
- Crisis Reporting: A sudden site outage means all data collected during that period is unreliable or missing.
Being aware of these categories helps you proactively identify risks in any analysis. The next step is communicating them.
How to Communicate with Stakeholders | Google Data Analytics Certificate
This short video from a Google analytical lead provides a perfect real-world example of this in action. She explains how she used available data to form a theory, but was very clear with stakeholders about the limitations of that data and what it couldn't prove.
Please watch from 01:08 to 02:57. Pay close attention to how she frames her findings as a 'theory' supported by data, explicitly states the limitations (i.e., 'I can't 100% know'), and then recommends a course of action based on being 'confident enough'.
This approach—"Here's what the data suggests, here's what it doesn't tell us, and here's my recommendation based on our level of confidence"—is a playbook you can use in countless situations.
2. Quantifying Uncertainty: The Power of Confidence Intervals
Acknowledging limitations is qualitative. But how do we quantify our uncertainty? The most common and effective tool for this in a business context is the confidence interval.
Think of it like a weather forecast. A meteorologist doesn't say, "It will rain exactly 0.5 inches tomorrow." They say, "We're 90% confident it will rain between 0.3 and 0.7 inches." This range is the confidence interval. It provides a "best guess with error bars," which is far more honest and useful than a single, precise-sounding number.
Understanding Confidence Intervals and How to Calculate Them
The team at Amplitude wrote an excellent, business-focused guide to confidence intervals. It explains the concept in plain language and shows how it applies directly to marketing and product decisions.
Please read the first two sections, 'What is a confidence interval?' and 'Confidence intervals in product and web experimentation'. Focus on the weather forecast analogy and the 'Buy Now' button A/B test example. This shows how to frame results as a range of likely outcomes.
Communicating Confidence Intervals Correctly
How you phrase your explanation is critical. There's a common statistical mistake that can confuse stakeholders and undermine your credibility if you're not careful.
Interpreting Confidence Intervals EXPLAINED in 3 Minutes with Examples
This short video explains the single most important rule for talking about confidence intervals. It's a small change in wording that makes a big difference in correctness and clarity.
Watch the whole video (it's short!). Pay special attention to the part starting at 01:49, which gives you the key takeaway: always use the word 'confident' instead of 'chance' or 'probability' when describing an interval.
So, the correct phrasing is:
- "We are 95% confident that the true conversion rate lift is between 2% and 6%."
And the incorrect phrasing is:
- "There is a 95% chance the true conversion rate lift is between 2% and 6%."
This might seem like splitting hairs, but for a data-savvy audience (and to be precise in your own thinking), the distinction matters. For most executive conversations, sticking to the word "confident" is the safest and clearest path.
Interpreting the Interval for Business Decisions
As a leader, your job is to interpret what the interval means for the business. Here are the key things to look at.
Understanding Confidence Intervals and How to Calculate Them
Let's return to the Amplitude article, which has a superb section on interpretation.
Please read the section titled 'Interpreting confidence intervals'. Focus on the practical meaning of the interval's width, what it means if intervals overlap, and especially, the importance of seeing if the interval includes zero.
Here's a summary of the key interpretation points for a leader:
- Does the interval include zero? If your interval for a change is, say,
[-1%, +5%], it means the true effect could be negative, zero, or positive. You can't be confident the change was an improvement. This is a critical signal to be cautious. - How wide is the interval? A very wide interval (e.g.,
[+1%, +20%]) signals a high degree of uncertainty. This often means you need more data (e.g., let the A/B test run longer). A narrow interval (e.g.,[+4%, +5%]) means you have a more precise estimate. - Where is the interval located? If the entire interval is positive and meaningful (e.g.,
[+3%, +8%]), you can be highly confident of a positive impact. If even the low end of the interval (+3%) represents a win for the business, it's a strong signal to move forward.
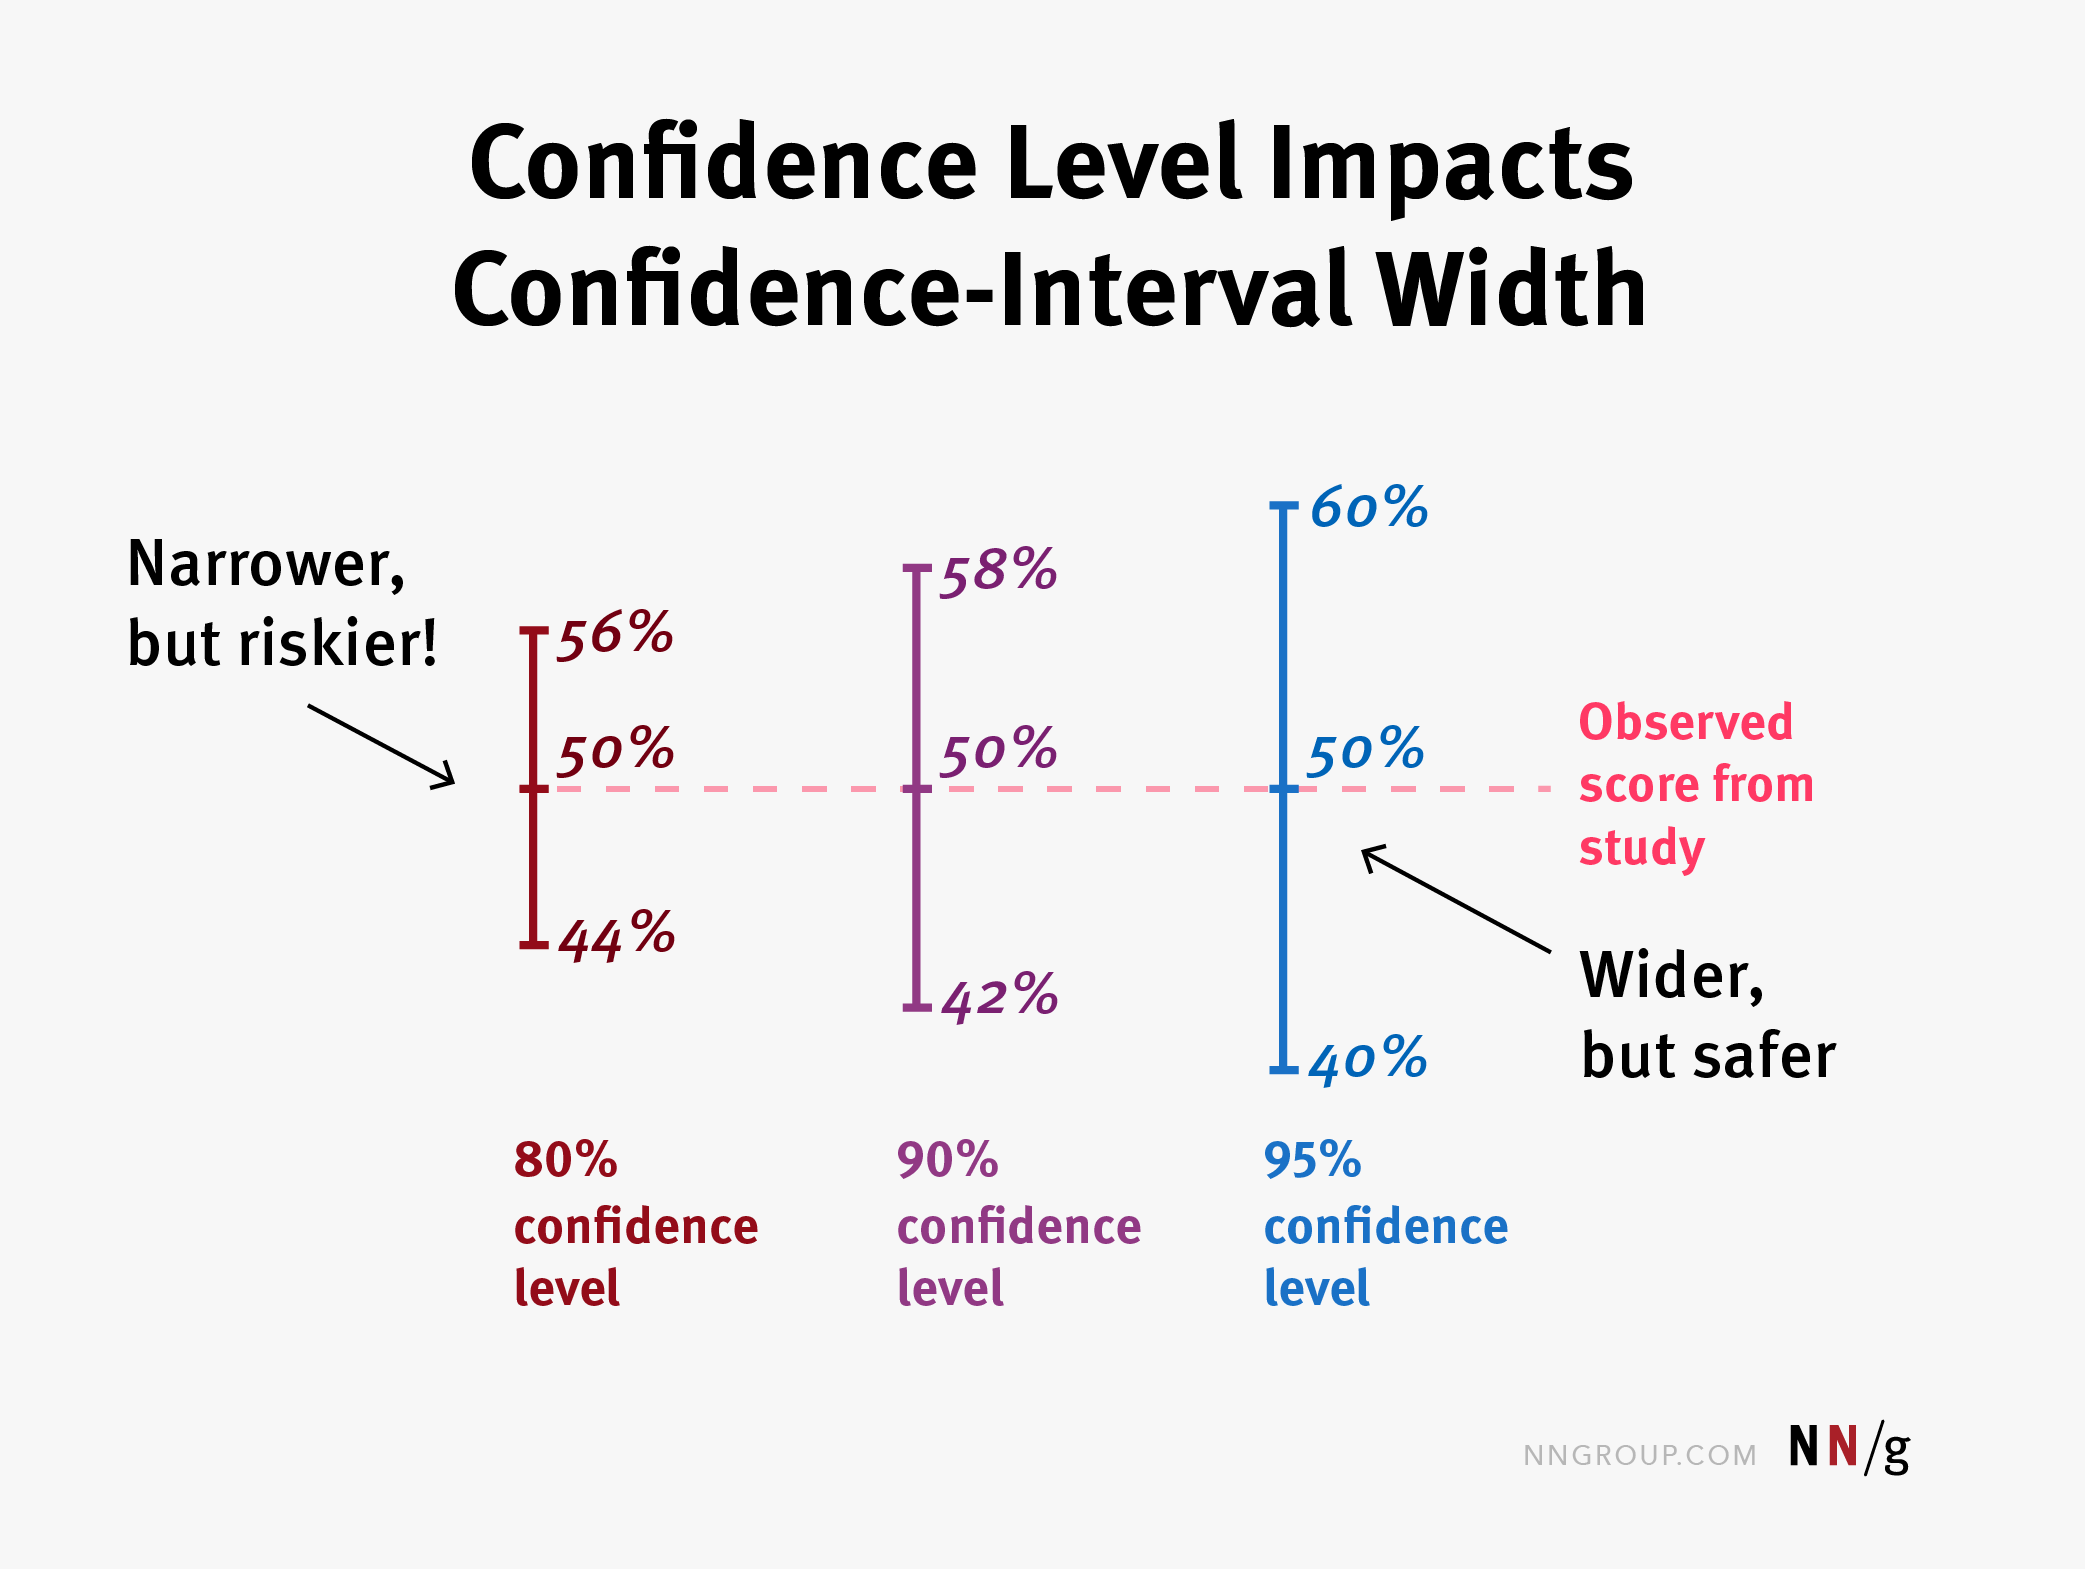
Finally, remember the trade-off between confidence and precision. To be more confident, you need a wider interval.
Test your understanding!
You ran an A/B test on a new headline for a Google Ads campaign. The results are in: the new headline has a Click-Through Rate (CTR) lift with a 95% confidence interval of [+0.5%, +1.5%].
Your CEO, who is focused on big wins, asks you if the test was a success and what to do next. How would you explain these results and what would you recommend?
Show answer
Here's a strong way to communicate this:
"The test was a success. We are 95% confident that the new headline increases our click-through rate by between 0.5% and 1.5% compared to the old one.
Because the entire range is positive, we know this is a real improvement. While it's not a massive game-changer, it's a guaranteed, positive lift.
My recommendation is to roll this new headline out to 100% of the campaign traffic. It's an easy, free win, and we can continue to test for bigger improvements from here."
This answer does several things right:
- It starts with a clear "yes" to the CEO's question.
- It correctly uses the "95% confident" phrasing.
- It translates the numbers into business impact ("real improvement," "guaranteed, positive lift").
- It provides a clear, actionable recommendation.
3. The Executive Communication Playbook
Communicating these concepts in a high-stakes executive meeting requires a specific strategy. Leaders want a decision, not a statistics lecture. Your role is to absorb the complexity and provide a clear recommendation that accounts for the uncertainty.
Communicating uncertainty to executives
This LinkedIn post from data leader Michael Kaminsky features advice from Cecilia Dones on this exact challenge. Her advice is pure gold for anyone aspiring to a strategic leadership role.
Read the main post and the transcript of Cecilia's advice. Her key strategy is to pre-align with other stakeholders (finance, sales, ops) before the executive meeting. Also, read the first comment from Dale W. Harrison, which offers great tactical tips like using 'HIGH-MID-LOW' ratings.
Let's distill this into a playbook:
- Do Your Homework: As Cecilia Dones advises, don't walk into a CEO meeting to debate uncertainty. Socialize your findings with other department heads first. Get their perspective and build a coalition around a recommendation. By the time you present to the C-suite, you should be able to say, "I've discussed this with the heads of Finance and Sales, and our collective recommendation is..."
- Lead with the Recommendation: Start with your conclusion, then provide the supporting evidence. Don't make the executives wade through the data to get to the point.
- Use Simple Analogies: The "weather forecast" or "best guess with error bars" are effective, non-technical ways to explain an interval.
- Simplify the Uncertainty: For some audiences, you can abstract away the numbers. Dale Harrison's suggestion of categorizing findings as having HIGH, MEDIUM, or LOW confidence can be very effective for a dashboard or summary slide.
- Visualize the Range: Use charts with error bars to visually represent the confidence interval. This makes the concept of a range intuitive.
Conclusion
As you move into more senior leadership roles, your value comes not just from finding insights in data, but from translating those insights into sound business decisions. Because data is inherently messy and uncertain, the ability to communicate limitations and confidence levels is not a "soft skill"—it is a core competency of modern leadership. It's how you build trust, manage risk, and steer the organization with clarity and intellectual honesty.
Key Takeaways:
- Be Proactive about Limitations: Always be upfront about what your data can and cannot tell you. It builds credibility.
- Use Confidence Intervals to Quantify Uncertainty: Frame results as a range of plausible outcomes (e.g., "We're 95% confident the lift is between 3% and 7%").
- Interpret, Don't Just Report: Explain what the interval means for the business. Does it include zero? Is it wide or narrow? Is even the low end of the range a win?
- Pre-Align with Stakeholders: Don't surprise executives with uncertainty. Work with peers in other departments to build a consensus recommendation that accounts for the risks.
Preview of the Next Lesson:
Now that you've learned how to structure a measurement plan (Lesson 2.6) and how to communicate its findings with nuance (this lesson), we'll turn our attention to evaluating the work of others. In the next lesson, "Critique a marketing report or dashboard for its clarity, relevance, and actionability," you'll learn how to apply a critical eye to the data visualizations and reports your team and other stakeholders produce, ensuring they drive insight, not confusion.