
Hello! Welcome back to your course on advanced performance marketing.
In our last lesson, we focused on the very top of the measurement pyramid by learning how to formulate a North Star Metric (NSM) and its key inputs. This gave us a powerful way to align the entire company around a single measure of customer value that is a leading indicator of revenue.
Today, we will build on that foundation. This lesson is about taking those high-level objectives—whether it's the NSM itself, one of its inputs, or another major business goal—and translating them into a complete and logical hierarchy of marketing Key Performance Indicators (KPIs). For a marketing leader, this is one of the most critical skills. It’s how you turn a statement like "we need to grow the business" into a clear, actionable, and measurable plan for your team.
This lesson directly addresses the learning outcome: Translate high-level business objectives into a hierarchy of marketing KPIs. By the end, you'll be able to deconstruct any major business goal into the specific marketing metrics that drive it, creating clarity and alignment for everyone from the C-suite to your campaign managers.
1. The Core Principle: Linking Metrics to Strategy
Before we start building hierarchies, let's establish the fundamental principle: a KPI without a connection to a strategic goal is just a number. It's noise, not a signal. As a leader, your first job is to ensure every metric you track is there to answer an important business question for a specific audience.
How To develop great KPIs (Key Performance Indicators) for your business, department or project
This short video from Bernard Marr, a leading expert on performance management, explains this concept well. He introduces the idea of a 'Key Performance Question' (KPQ) as the starting point for any good KPI.
Watch from 00:34 to 02:10. Focus on the idea that every KPI must be linked to a strategic goal and should be designed to answer a 'Key Performance Question' for a specific audience (e.g., the board, a department head).
This discipline of linking metrics to questions and goals is what transforms data into a strategic asset. Let's look at a real-world example of this thinking.
The SaaS business model & metrics: Understand the key drivers for success
Venture capitalist David Skok provides a masterclass in breaking down a complex business model (Software-as-a-Service, or SaaS) into a hierarchy of connected metrics. While the specifics are for SaaS, the logical process of deconstruction is universal and highly relevant to your role.
Watch the following clips, focusing on how he breaks down a big goal into smaller, measurable drivers: The Main Goal (2:03 - 3:51): Understand the high-level objective: building a 'repeatable, scalable, and profitable growth machine.' Breaking Down Growth (4:27 - 5:41): See how the 'growth' objective is translated into measurable components: new revenue, expansion revenue, and churned revenue. The Funnel View (5:41 - 8:33): Notice how he uses a marketing and sales funnel to create a mathematical relationship: Leads × Conversion Rate × Deal Size = Bookings. The Profitability View (11:53 - 12:31): See how the 'profitability' objective is measured with the LTV:CAC ratio. Pay attention to how every metric connects back to the main goal.
As you saw, a single high-level objective was systematically broken down into its core drivers. This is the essence of building a KPI hierarchy. Now, let's learn two practical frameworks to help you do this for your own business.
2. Structuring the Hierarchy: The KPI Pyramid
A simple and effective way to organize your metrics is the KPI Pyramid. This framework organizes KPIs into three distinct levels, aligning the entire organization from top to bottom.
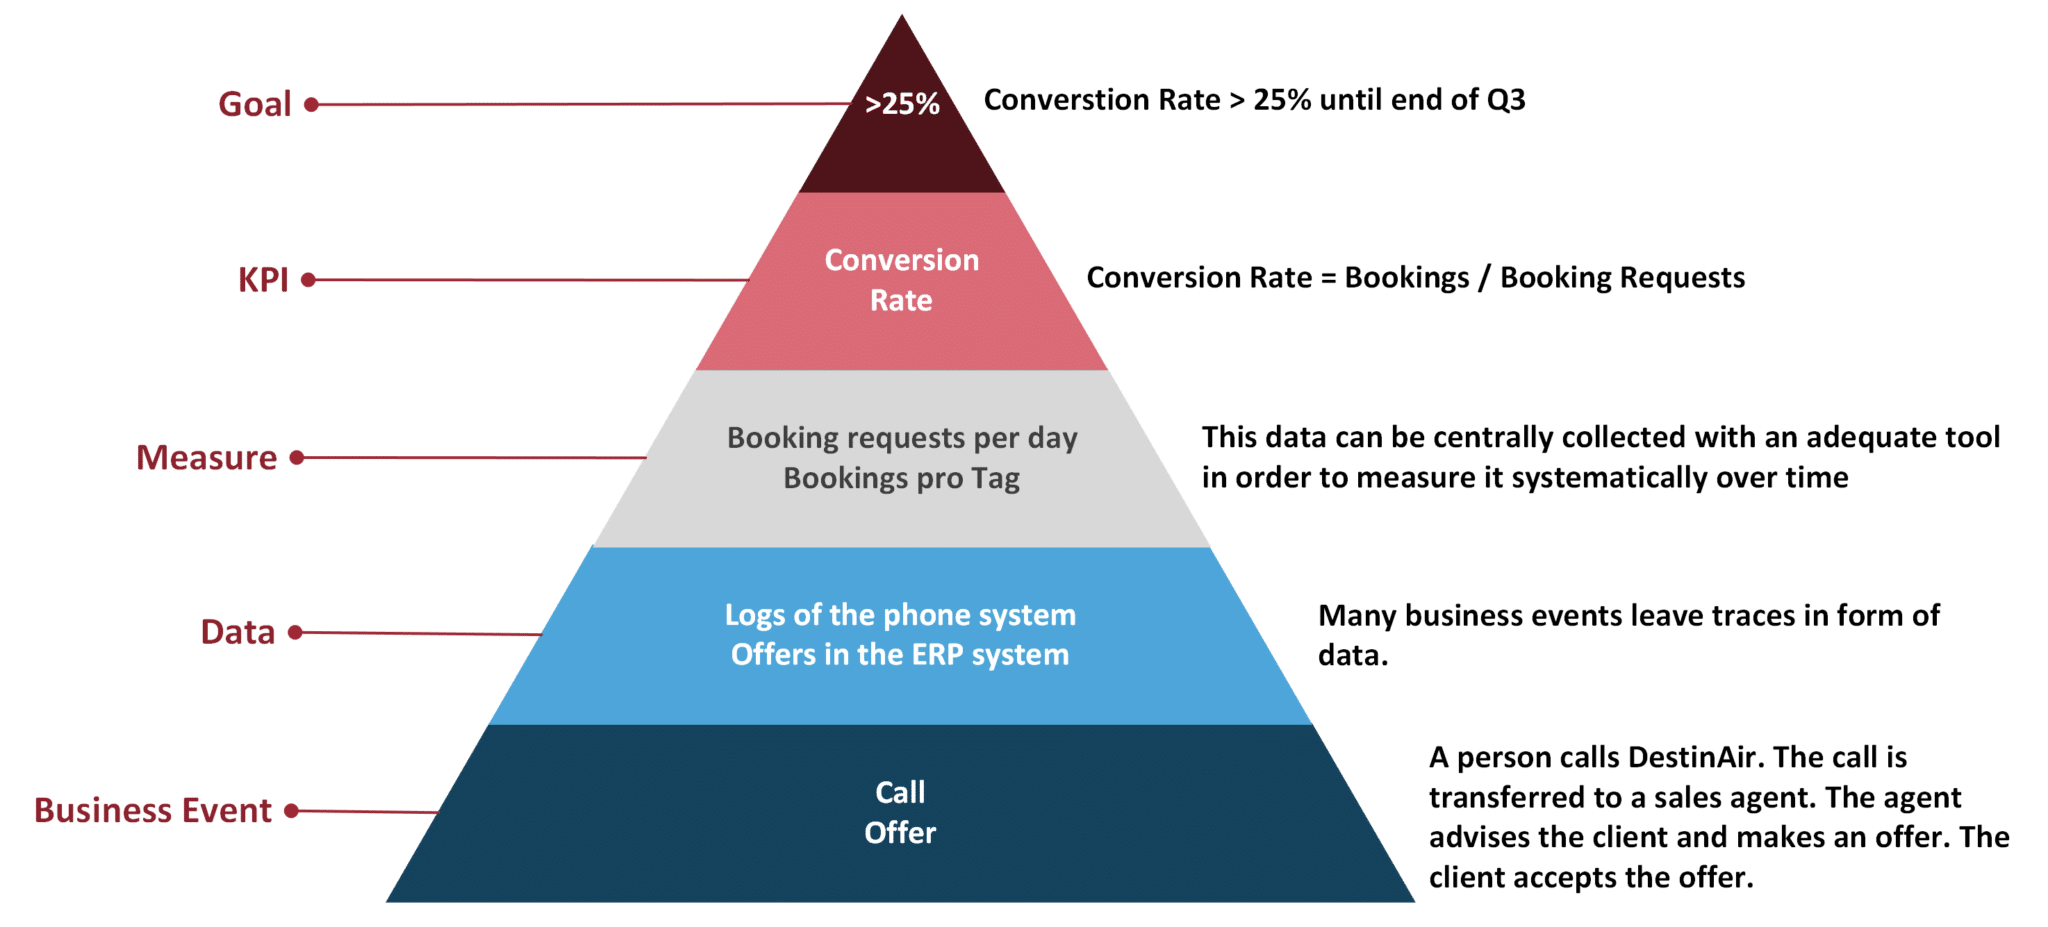
The pyramid consists of three layers:
-
Strategic KPIs (Top Level): These are the big-picture metrics that reflect the overall health and long-term objectives of the business. They are the primary concern of the C-suite and board.
- Examples: Revenue Growth Rate, Net Profit Margin, Market Share, Customer Lifetime Value (LTV).
-
Tactical KPIs (Middle Level): These measure the performance of specific departments and business functions. They bridge the gap between high-level strategy and daily operations. This is the level where, as a marketing leader, you will spend most of your time.
- Examples for Marketing: Customer Acquisition Cost (CAC), Lead-to-Customer Conversion Rate, Incremental ROAS (iROAS), Website Conversion Rate.
-
Operational KPIs (Bottom Level): These track the performance of day-to-day activities and processes, often in real-time. They are used by frontline team members (your social media managers, SEO specialists, etc.) to optimize their work.
- Examples for Marketing: Cost Per Click (CPC), Click-Through Rate (CTR), Ad Impressions, Keyword Rankings, Email Open Rate.
KPI Pyramid: Align Business Goals with Daily Metrics
This article from SimpleKPI provides a clear and concise explanation of the KPI Pyramid and its three levels.
Please read the sections 'What is the KPI Pyramid?', 'Breaking Down the KPI Pyramid: The Three Layers', and 'How to Align KPIs at Every Level'. Focus on the definition, user, and examples for each of the three levels.
The power of the pyramid is in its alignment. An improvement in an Operational KPI (e.g., lowering CPC) should lead to an improvement in a Tactical KPI (e.g., a better CAC), which in turn contributes to a Strategic KPI (e.g., higher profit margin).
3. Visualizing the Connections: The KPI Tree
While the pyramid defines the "altitude" of your metrics, the KPI Tree is a visual tool that maps the specific, mathematical relationships between them. It helps you and your team understand exactly how your daily work drives high-level results.
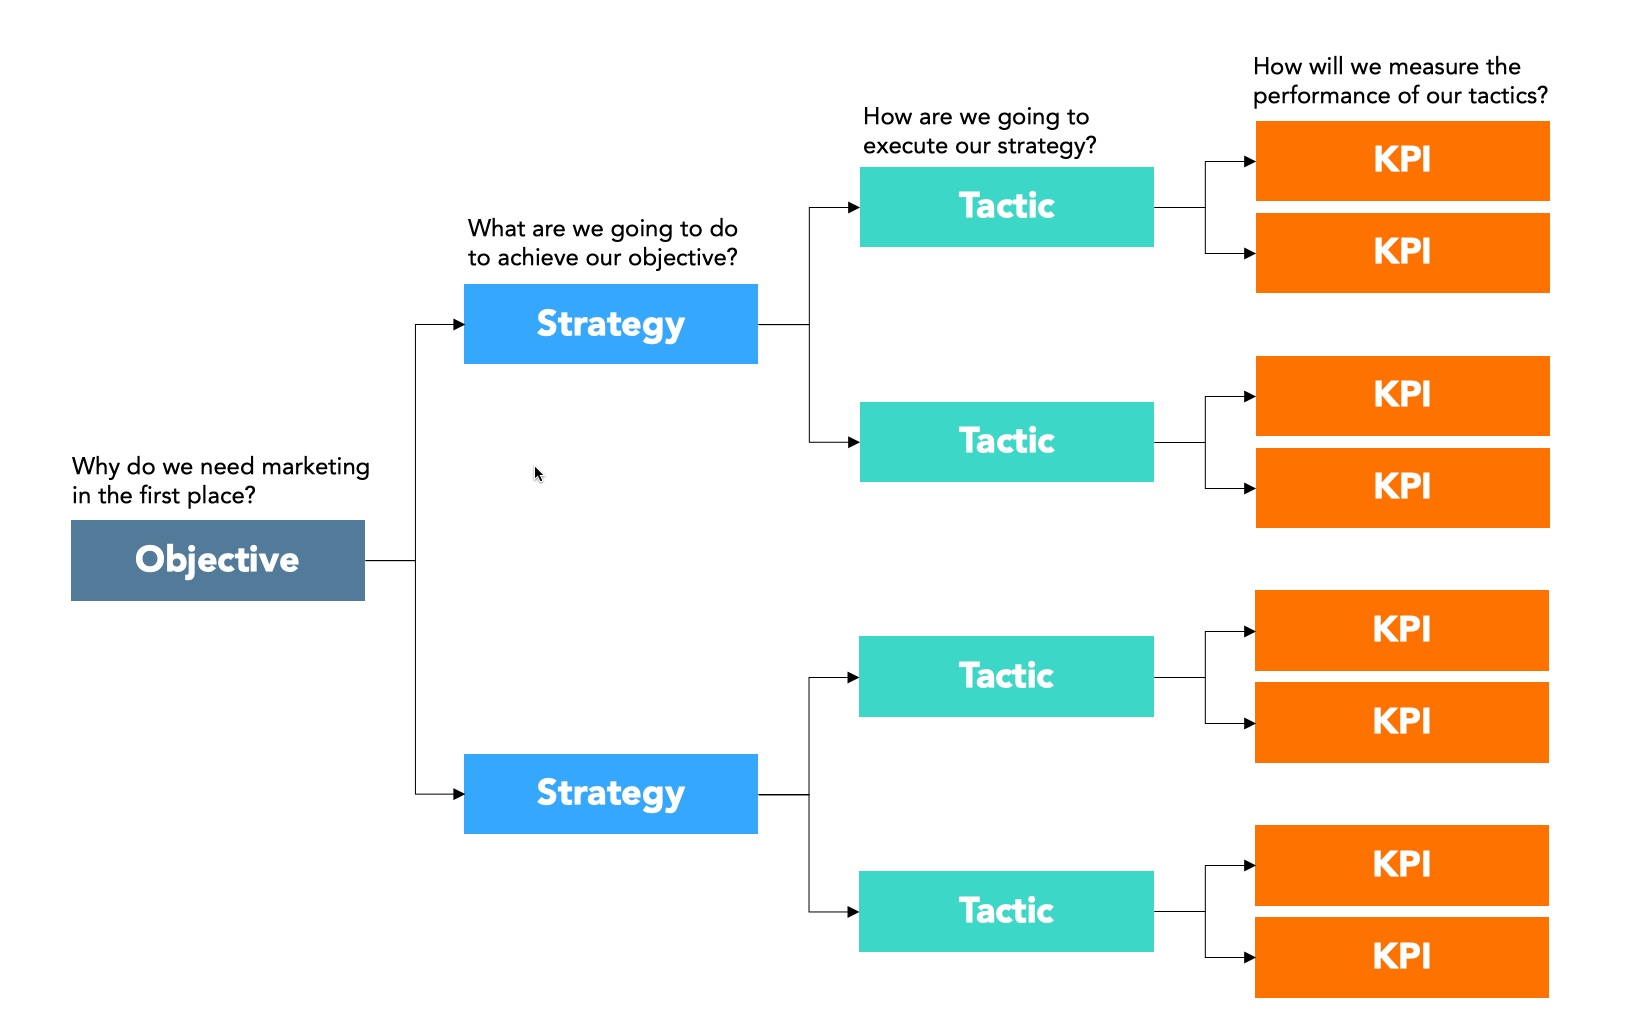
A KPI tree starts with a single objective at the top (the trunk) and branches out into the various drivers that contribute to it. This is a very practical tool for you as a leader to map out your team's entire measurement plan.
KPI Trees: How to Bridge the Gap Between Customer ...
This excellent article from Petra Wille provides a step-by-step guide to building a KPI Tree. It uses a relatable story to explain the process and introduces a crucial distinction between different types of metric relationships.
Please read the sections 'Introduction: What are KPI trees...', 'Meet our heroine: Maxine', 'The two ways to grow your tree', and 'How to build and maintain your own KPI tree'. Focus on how the team breaks down their top goal using both mathematical equations (for acquisition) and hypotheses (for retention). This distinction is a core concept for strategic thinking.
As the article highlighted, there are two ways to connect branches in your tree:
- Mathematical Relationships: These are direct, formulaic connections. They are undeniable truths about your business. Your experience with ad platforms gives you a strong intuition for these.
Revenue = Traffic × Conversion Rate × Average Order ValuePaid Traffic = Impressions × Click-Through Rate
- Hypothesized Relationships: These are educated guesses about behavior that you need to test and validate. They are not formulas.
- Hypothesis: "Increasing the number of 5-star product reviews will increase the conversion rate for that product." This seems logical, but it's an assumption until proven with data (e.g., through an A/B test).
As a leader, distinguishing between these two is vital. Mathematical relationships are for monitoring and reporting; hypothesized relationships are for your experimentation and learning roadmap.
Test your understanding!
Your company's strategic objective for the quarter is to "Increase new customer acquisition by 15%." This is a top-level, Strategic KPI.
How would you start building a KPI tree for your marketing team to translate this into Tactical and Operational KPIs? Describe the first few branches.
Show answer
Here’s one way to start building that tree:
-
Top of the Tree (Strategic KPI):
# of New Customers -
First Branch (Decomposition): Break it down by source. This is a mathematical relationship.
# New Customers = # from Paid Channels + # from Organic Channels + # from Other
-
Second Branch (Tactical KPIs): Let's focus on the
# from Paid Channelsbranch. We can use a classic funnel formula.# from Paid Channels = Paid Traffic × Site CVR for New Users
-
Third Branch (Operational KPIs): Now, let's break down
Paid Traffic.Paid Traffic = Impressions × CTR
This simple tree creates a clear hierarchy:
- Strategic:
# of New Customers - Tactical:
Site CVR for New Users,# from Paid Channels - Operational:
Impressions,CTR
Your team now has a clear map. The paid media specialists know they can impact the goal by improving CTR or finding more efficient impressions. The web/CRO team knows they can contribute by improving the Site CVR for new users. You, as the leader, can see how all the pieces fit together.
Conclusion
You can't manage what you don't measure, but measuring everything is the same as measuring nothing. The frameworks we discussed today—the KPI Pyramid and the KPI Tree—are essential tools for a marketing leader to bring focus, clarity, and alignment to their organization. They create a direct line of sight from the company's highest-level strategic goals to the daily work of every person on your team.
Key Takeaways:
- Every KPI should be linked to a strategic goal and answer a key business question.
- The KPI Pyramid helps you structure metrics by audience and purpose: Strategic (for executives), Tactical (for department heads), and Operational (for specialists).
- The KPI Tree is a visual tool to map the mathematical and hypothetical relationships between metrics, showing how they influence each other.
- As a leader, your role is to build this hierarchy, assign ownership of the different branches, and orchestrate the teams to drive the top-level objective.
Preview of the Next Lesson:
Now that we know how to build a clear measurement hierarchy, what happens when the data isn't perfect? In our next lesson, "Communicate data limitations and confidence levels effectively to non-technical stakeholders," we will tackle a critical leadership skill. You'll learn how to present your findings with intellectual honesty, explaining the nuances, limitations, and confidence levels in your data to ensure that senior leaders make decisions with a clear understanding of the associated risks and uncertainties.