
Hello! Welcome to the next lesson in our Medical Instrumentation course.
In the previous lesson, we delved into invasive hemodynamic monitoring, focusing on how catheter-transducer systems provide a continuous, high-fidelity measurement of blood pressure. We saw that pressure is a critical indicator of cardiovascular function.
Today, we turn to the other side of the hemodynamic coin: blood flow. This lesson addresses the learning outcome: Explain the principles of electromagnetic and ultrasonic Doppler techniques for blood flow measurement. We will investigate two powerful methods for quantifying the movement of blood, one based on magnetic fields and the other on sound waves. Understanding these non-invasive and minimally invasive techniques is crucial, as the principles of Doppler, in particular, appear in many areas of sensing technology.
1. Electromagnetic Flow Measurement
The first technique we'll explore leverages a fundamental principle of physics you've likely encountered before: Faraday's Law of Induction. This law states that a conductor moving through a magnetic field will generate a voltage. Since blood is an electrically conductive fluid (due to its ionic composition), we can use this principle to measure its flow.
To see how this is implemented, let's watch a short video.
The Electromagnetic Flow Measuring Principle
This animation from Endress+Hauser clearly demonstrates the working principle of an electromagnetic flowmeter. Although it shows an industrial application, the physics is identical to its use in medical devices.
Watch from the beginning to 03:14. As you watch, focus on: The essential components: field coils to generate the magnetic field and electrodes to measure the voltage. Why the liquid (in our case, blood) needs to be conductive. The relationship between the flow velocity and the induced voltage.
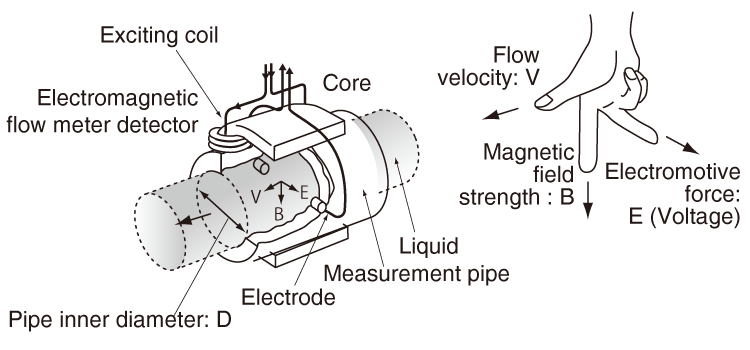
As the video explained, the core mechanism is as follows:
- Magnetic Field: Two coils create a magnetic field across the diameter of the blood vessel.
- Conductive Flow: Blood flows with an average velocity through this magnetic field.
- Charge Separation: The magnetic field exerts a force on the charged ions in the blood, separating positive and negative charges to opposite sides of the vessel wall.
- Induced Voltage: This separation of charge creates an electrical potential difference, or voltage , across the vessel. This voltage is directly proportional to the flow velocity.
- Measurement: Two electrodes placed on the vessel wall, perpendicular to both the flow and the magnetic field, pick up this induced voltage.
The relationship is described by the simple equation:
where is the diameter of the blood vessel.
Application & Limitations:
This method provides a highly accurate measurement of flow. However, it requires placing a probe or cuff containing the coils and electrodes directly around the blood vessel. For this reason, its medical use is generally limited to:
- Intra-operative monitoring: A surgeon can place a probe around a major vessel during surgery to measure flow.
- Extracorporeal circuits: Measuring flow in the tubing of a heart-lung machine during bypass surgery.
- Animal research: Used in labs for precise hemodynamic studies.
It is not a transcutaneous (through the skin) technique.
2. Ultrasonic Doppler Flow Measurement
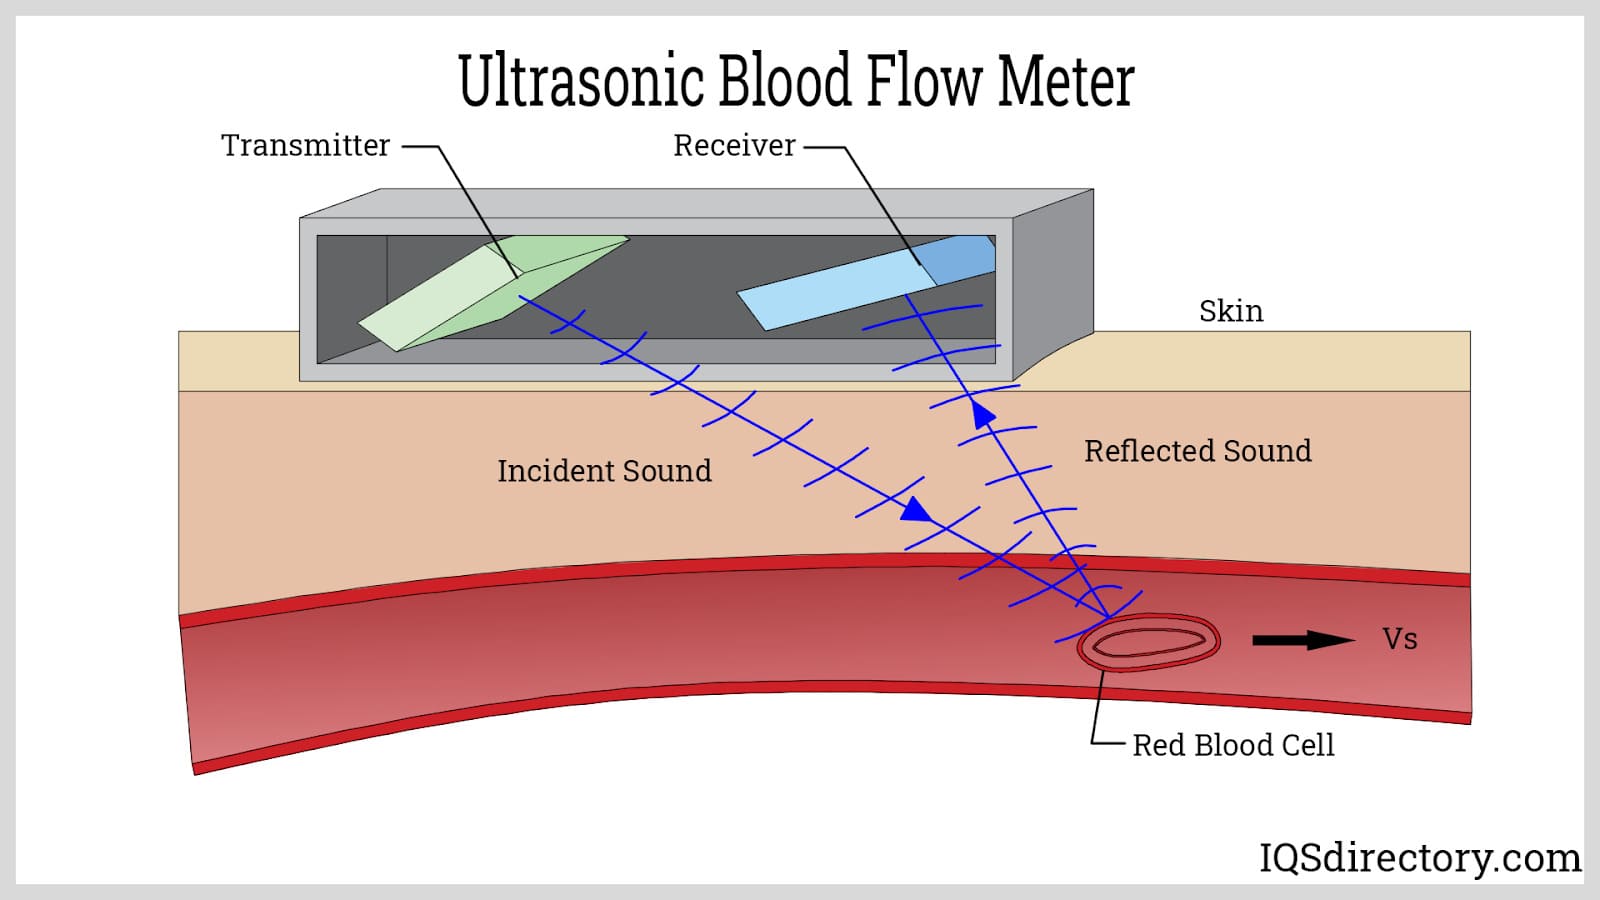
A more common and non-invasive method for measuring blood flow uses ultrasound and the Doppler effect. This is the same principle that allows meteorologists to track storms and police to check vehicle speeds.
The fundamental idea is that when an ultrasonic wave is reflected by a moving object—in this case, red blood cells—its frequency is shifted.
Let's start with a video that uses a familiar analogy to explain this core concept.
Ultrasound Physics - Explaining Doppler
This short clip from SIMTICS provides an excellent and simple analogy for the Doppler effect and introduces the key types of Doppler ultrasound used in medicine.
Please watch from 00:57 to 01:27. This will give you the essential conceptual foundation for the Doppler shift.
The Doppler Equation
The frequency change, known as the Doppler shift (), is directly proportional to the velocity of the blood cells. The relationship is given by the Doppler equation:
Where:
- = Doppler shift frequency (the difference between transmitted and received frequencies).
- = Source frequency of the transmitted ultrasound (typically 2-10 MHz).
- = Velocity of the blood cells.
- = Speed of sound in tissue (approximately 1540 m/s).
- = The angle between the ultrasound beam and the direction of blood flow.
To find the velocity, we rearrange the equation:
This equation is fundamental to passing your exam and understanding how these devices work. Note the factor of 2, which arises because the Doppler shift occurs twice: once when the moving cells "receive" the wave, and again when they "re-transmit" it back to the probe.
The angle is critical. If the beam is perpendicular to the flow (), , and no Doppler shift is detected. For the best signal, the angle should be as small as possible (). In practice, an angle of 60° or less is used as a compromise.
Types of Doppler Ultrasound
There are two main ways to implement the Doppler principle.
1. Continuous Wave (CW) Doppler
- Principle: Uses two separate piezoelectric crystals in the transducer; one continuously transmits ultrasound, and the other continuously receives the reflected signals.
- Advantage: Simple and can measure very high blood velocities without a limit.
- Disadvantage: Range ambiguity. It detects all flows along the entire path of the ultrasound beam. You cannot determine the specific depth at which a velocity is occurring. This is like listening to all the conversations in a hallway at once without knowing which room they're coming from.
2. Pulsed Wave (PW) Doppler
- Principle: Uses a single crystal that alternates between transmitting short bursts (pulses) of ultrasound and then "listening" for the returning echoes.
- Advantage: Range resolution. By controlling the time delay between sending a pulse and listening for its return, the system can be instructed to measure velocity at a specific, user-defined depth. This small region of interest is called the sample volume.
- Disadvantage: There is a maximum velocity that can be accurately measured, a limit imposed by the sampling rate of the pulses.
To get a deeper understanding of PW Doppler and its limitations, which connects directly to signal processing principles from your ECE background, please review the following text.
Pulsed Wave Doppler – The Cardiovascular - ECGWaves
This article from ECGWaves.com provides a fantastic technical explanation of Pulsed Wave Doppler, including its key parameters and the critical concept of aliasing.
Please read the sections titled 'Pulsed Wave Doppler', 'Sample volume (SV)', 'Pulse repetition frequency (PRF)', 'Nyquist’s theorem and Nyquist limit', and 'Aliasing phenomenon'. Focus on understanding how PW Doppler achieves depth-specificity and what causes the 'aliasing' artifact.
The Nyquist Limit and Aliasing
As the article you just read explained, PW Doppler is governed by the Nyquist-Shannon sampling theorem.
- The sampling rate is the Pulse Repetition Frequency (PRF).
- To measure a frequency accurately, you must sample at more than twice that frequency.
- Therefore, the maximum Doppler shift frequency () that can be measured is half the PRF: . This is the Nyquist Limit.
- If the blood velocity is so high that it produces a Doppler shift greater than the Nyquist limit, the system can no longer correctly determine the velocity and direction. This artifact is called aliasing. On a spectral display, the velocity waveform appears to "wrap around" from the top of the scale to the bottom.
Test your understanding!
An operator is using a PW Doppler system to measure blood flow in an artery where the flow is expected to be very fast. On the display, the velocity waveform looks chaotic, with the top of the waveform cut off and appearing at the bottom of the display.
- What is this phenomenon called?
- What is the fundamental reason it's happening, in terms of sampling theory?
- What are two adjustments the operator could make to the system to try and resolve this? (Hint: Think about the Doppler equation and the Nyquist limit).
Show answer
- This phenomenon is called aliasing.
- The fundamental reason is that the Doppler shift frequency caused by the high-velocity blood flow exceeds the Nyquist limit (). The system's sampling rate (the PRF) is too low to correctly represent the high-frequency shift.
- To resolve this, the operator needs to either increase the Nyquist limit or decrease the Doppler shift frequency:
- Increase the PRF: A higher PRF raises the Nyquist limit, allowing higher velocities to be measured before aliasing occurs. This is often done by moving the baseline on the display or decreasing the imaging depth.
- Use a lower frequency transducer (): According to the Doppler equation (), for the same velocity , a lower source frequency will produce a lower Doppler shift . This lower may now fall below the Nyquist limit.
- (A third option would be to switch to Continuous Wave (CW) Doppler, which does not have a Nyquist limit and is ideal for measuring very high velocities.)
Conclusion
In this lesson, we have explored two distinct but powerful methods for measuring blood flow. While both provide crucial hemodynamic information, they operate on entirely different physical principles and have different clinical applications.
Key Takeaways:
- Electromagnetic flowmeters use Faraday's Law of Induction. They are highly accurate but invasive, requiring a probe to be placed around the vessel.
- Ultrasonic Doppler flowmeters use the frequency shift of sound waves reflecting off moving red blood cells. They are non-invasive and widely used.
- The Doppler equation is the key formula that relates the measured frequency shift to blood velocity.
- Continuous Wave (CW) Doppler can measure high velocities but lacks depth information (range ambiguity).
- Pulsed Wave (PW) Doppler can measure velocity at a specific depth (sample volume) but is limited by the Nyquist limit, which can lead to an aliasing artifact at high velocities.
Preview of the Next Lesson:
We've now seen how to measure pressure and velocity. In our next lesson, we will examine techniques to measure cardiac output—the total volume of blood pumped by the heart per minute. We will discuss indicator dilution and thermodilution methods, which build directly on the concepts of the Pulmonary Artery Catheter we covered in the previous lesson.
Can't find a good explanation? Sign up and we'll make it for you
Sign up