
Hello again. Last lesson established the observation grain: the business meaning of one row. For example, a sales table might contain one row per order line rather than one row per order.
Now we will classify the fields within that row. This is an essential analyst habit because field names and data types can be misleading: a numeric CustomerID is not a measure, while a numeric Quantity usually is. By the end of the lesson, you will be able to label fields as identifiers, dimensions, measures, or dates, and explain the reasoning in business terms.
Four roles a field can play
A field’s role depends on how it is used in analysis, not only whether it contains text, numbers, or dates.
| Field role | Main purpose | Typical analytical use | Examples |
|---|---|---|---|
| Identifier | Uniquely identifies a record or links it to another table | Matching, joining, de-duplicating, distinct counting | order_id, customer_id, product_key |
| Dimension | Describes, categorises, or gives context to a record | Filtering, grouping, segmenting | region, product_category, sales_channel |
| Measure | Quantifies something that happened or was observed | Summing, averaging, finding minimum/maximum | sales_amount, quantity, profit |
| Date | Places a record in time | Trend analysis, period grouping, date filtering | order_date, ship_date, month_end_date |
Dates are technically a kind of dimension: they provide context rather than an amount to add up. In practical analysis, however, it is useful to classify them separately because time-based questions are so common:
- How did revenue change month by month?
- Which quarter had the highest margin?
- Were deliveries slower this week than last week?
The most important principle is:
Classify a field by its business meaning and analytical purpose, not merely by its storage type.
For example, all of the following could be stored as numbers:
| Field | Correct role | Why |
|---|---|---|
customer_id | Identifier | It labels a customer; averaging customer IDs has no business meaning. |
postal_code | Dimension | It describes a location; summing postcodes is meaningless. |
order_date_key | Identifier | It may link a sales row to a date table, even if it looks like 20250402. |
quantity | Measure | It represents units sold and can usually be summed. |
discount_pct | Measure | It quantifies a discount, though it requires care when averaging. |
Dimensions and measures: the analytical split
A useful first distinction is between describing a business event and quantifying it.
Suppose each row represents one product line on one customer order:
| order_id | order_date | channel | product_category | customer_region | quantity | line_revenue |
|---|---|---|---|---|---|---|
| SO-1001 | 2025-04-02 | Online | Electronics | South | 2 | 40 |
| SO-1001 | 2025-04-02 | Online | Accessories | South | 1 | 25 |
| SO-1002 | 2025-04-03 | Retail | Electronics | West | 3 | 60 |
channel, product_category, and customer_region are dimensions. They answer questions such as:
- Which channel generated the most revenue?
- How does sales vary by region?
- Which category has the largest quantity sold?
quantity and line_revenue are measures. They are the values being calculated:
- Total quantity sold
- Total revenue
- Average revenue per line
- Highest-revenue category
This relationship is the basis of most reports:
Use dimensions to organise the analysis; use measures to calculate the result.
Tableau Dimensions and Measures EXPLAINED | #Tableau Course #46
Watch “Tableau Dimensions and Measures EXPLAINED” by Data with Baraa for a visual explanation of how dimensions provide analytical context while measures provide values to calculate.
Watch the core model to see dimensions and measures placed in a sales-analysis example. Then watch the classification rule, which gives a practical test for numeric fields. Continue with customer examples, paying particular attention to why IDs and postcodes are not measures. Finally, watch order examples for a sales-table classification.
A quick test for a potential measure is:
Would a sum, average, minimum, maximum, or other numerical calculation answer a meaningful business question?
If yes, it is probably a measure. If the calculation is nonsensical, it is probably a dimension or identifier.
Measures and dimensions | Metabase Learn
Read “Measures and dimensions” from Metabase Learn for a compact explanation of the difference between descriptive fields and computable fields, including the important exception that IDs can look numeric without being measures.
Read the section “Dimensions: the who, what, where, and when of your data,” then continue through “Measures: numerical fields that you can compute.” Focus on the dimensions discussion, especially the examples of IDs and dates. Then read the measures discussion and note the kinds of operations that make business sense for a measure.
Identifiers: labels and links, not quantities
An identifier is a field whose primary job is to identify something: a record, order, customer, product, invoice, or account.
Identifiers may be:
- Unique within their own table, such as a
customer_idin a customer table. - Repeated in another table to create a link, such as
customer_idin a sales table. A customer can make many purchases, so repetition is expected there. - Composite, meaning several fields together identify a row. In an order-line table,
order_idplusline_numbermay identify one row.
This connects directly to the prior lesson on grain. If each row is one order line, then:
| Field | Role | Reason |
|---|---|---|
sales_order_line_key | Identifier | Identifies the individual row. |
order_id | Identifier | Identifies the order to which the line belongs, but may repeat. |
customer_id | Identifier | Identifies the purchasing customer. |
product_id | Identifier | Identifies the product sold. |
line_number | Identifier component | Distinguishes lines within a repeated order ID. |
An identifier is not automatically a measure just because it is numeric. Consider the values 101, 102, and 103 for customer_id. Their sum, 306, does not reveal anything about customers. The values are labels, not quantities.
Identifiers are often useful for:
- checking duplicates;
- counting distinct entities, such as distinct customers or distinct orders;
- joining tables;
- tracing unusual records back to a source system.
They should not normally appear as totals on a report.
Primary keys and foreign keys
You will study keys and joins in more detail in the SQL module. For now, use these practical definitions:
- A primary key identifies each row in its own table. For instance,
product_keyshould uniquely identify each product in a product table. - A foreign key is an identifier stored in one table that refers to a row in another table. For instance,
product_keyin a sales table points to the matching product in the product table.
The same field can therefore be a primary key in one table and a foreign key in another.
Modeling Dimension Tables in Warehouse - Microsoft Fabric
Microsoft Fabric’s “Modeling Dimension Tables in Warehouse” introduces the distinction between system-generated identifiers, source-system identifiers, and descriptive attributes. Read it to strengthen your ability to recognise IDs in real business models.
In “Dimension table structure,” read the subsections “Surrogate key,” “Natural keys,” and “Dimension attributes.” In the first subsection, focus on the surrogate-key rationale. Then read the natural-key discussion. Finish with the dimension-attribute explanation. You can ignore the historical-tracking and audit-field details for now.
A natural key comes from the business or source system, such as an employee number or invoice number. A surrogate key is an internal identifier generated for the database, such as CustomerKey = 7834. From an analyst’s perspective, both are identifiers: neither is a quantity to sum.
Dates: dimensions with special analytical importance
A date field records when an event occurred or when a value was observed.
Common examples include:
order_dateinvoice_dateship_datepayment_datemonth_end_datecreated_atlast_updated_timestamp
Dates enable time-based analysis. With order_date and sales_amount, you can calculate monthly revenue, compare quarters, or plot a daily trend.
Do not confuse a date with a numeric date key:
| Field | Likely role | Reason |
|---|---|---|
order_date | Date | A real calendar date used for time analysis. |
ship_timestamp | Date | Contains date and time of shipment. |
date_key in a Date table | Identifier | Identifies a date-table row. |
order_date_key in Sales | Identifier | Links a sales row to the Date table. |
fiscal_quarter | Date-related dimension | A time-period label used to group or filter. |
month_name | Date-related dimension | A descriptive label such as “April.” |
month_number | Date-related dimension | Used for sorting calendar periods, not summing. |
A field like month_number may contain 1 through 12, but it is not a measure. Adding month numbers produces a meaningless result. Its purpose is to describe or organise time.
Applying the classification to a sales model
The Dimensional sales model below shows a common structure used in Power BI: a central Sales table holds transactional fields, while surrounding tables provide descriptive context.
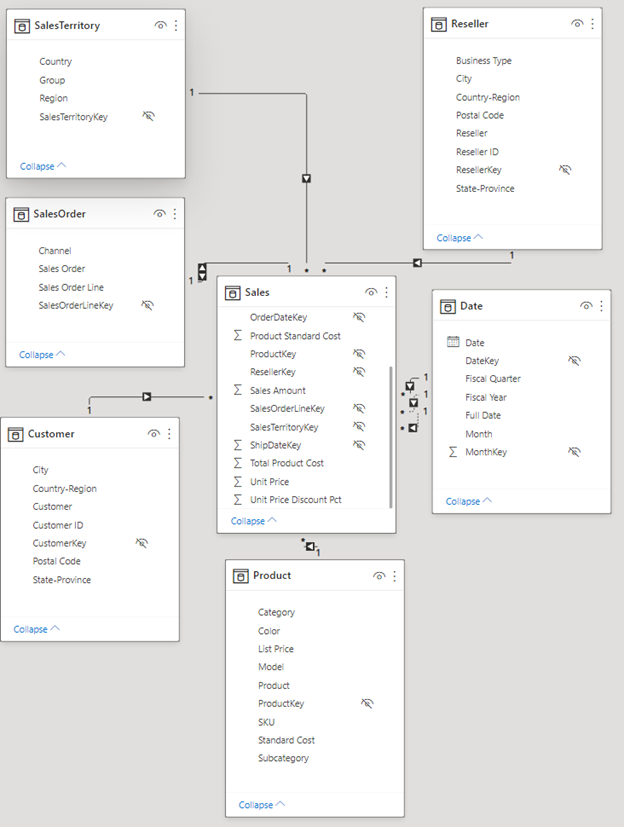
Start with the central Sales table. It contains fields such as ProductKey, ResellerKey, SalesOrderLineKey, OrderDateKey, Sales Amount, Unit Price, and Total Product Cost.
A sensible classification is:
| Table | Field examples | Classification | Reason |
|---|---|---|---|
Sales | SalesOrderLineKey | Identifier | Identifies an individual sales-line record. |
Sales | ProductKey, ResellerKey, SalesTerritoryKey | Identifiers | Link each sale to a product, reseller, or territory. |
Sales | OrderDateKey, ShipDateKey | Identifiers | Link each sale to particular rows in the Date table. |
Sales | Sales Amount, Unit Price, Unit Price Discount Pct, Total Product Cost | Measures | Quantify monetary amounts, prices, discounts, or costs. |
Product | Category, Color, Model, Subcategory | Dimensions | Describe products for grouping and filtering. |
Customer | City, Country-Region, State-Province | Dimensions | Describe customer geography. |
Reseller | Business Type, City, Postal Code | Dimensions | Describe the reseller and its location. |
Date | Date | Date | Supports analysis over time. |
Date | Fiscal Quarter, Fiscal Year, Month | Date-related dimensions | Organise dates into useful reporting periods. |
Notice two patterns:
- The central
Salestable has many measures because it records business events and their amounts. - The surrounding tables have many dimensions because they describe products, customers, resellers, territories, and dates.
This is why analysts might ask for “sales by product category and month.” In that request:
- Sales Amount is the measure.
- Product Category is a dimension.
- Month is a date-related dimension.
The word “by” is often a useful clue. “Revenue by region,” “orders by channel,” and “margin by product category” all point to dimensions used to segment a measure.
Classification is not the same as aggregation
Calling a field a measure does not mean that summing it is always correct. You must still return to the grain of the table.
Consider an order-line dataset:
| order_id | product | quantity | line_revenue | shipping_charge |
|---|---|---|---|---|
| SO-1001 | Laptop | 1 | 900 | 20 |
| SO-1001 | Mouse | 1 | 25 | 20 |
All three numeric business values are measures:
quantitymeasures units;line_revenuemeasures line-level sales;shipping_chargemeasures an order-level charge.
But the table grain is one product line per order. shipping_charge is repeated across lines because it belongs to the whole order. Summing it at line level would double-count the order’s shipping.
So use two separate questions:
-
What role does this field play?
shipping_chargeis a measure. -
At what grain is this measure valid?
It is valid at the order level, not the order-line level.
This distinction will protect you from many plausible-looking but incorrect totals.
A repeatable field-classification routine
When you open a new spreadsheet, CSV, database table, or dashboard model, classify fields in this order:
-
Check whether the field identifies or links records.
Look for names such as_id,_key,order_number,invoice_no, orline_number. Confirm with the table grain where possible. -
Check whether it represents a date or time.
Look for actual dates, timestamps, month-end dates, or date-period attributes such as fiscal year. -
Check whether it describes a person, product, place, status, channel, or category.
These are dimensions. They usually answer “who,” “what,” “where,” or “which group?” -
Check whether it quantifies something meaningful.
Revenue, cost, quantity, duration, balance, and discount are usually measures. -
Test your interpretation against the business question and grain.
A field can be a measure but may still need a specific aggregation rule. A numeric field can be an identifier or dimension rather than a measure.
A compact data-dictionary entry might look like this:
| Field | Role | Definition | Aggregation note |
|---|---|---|---|
order_id | Identifier | Business identifier for a customer order | Count distinct orders; do not sum. |
order_date | Date | Date on which the order was placed | Group by day, month, quarter, or year. |
channel | Dimension | Sales route, such as Online or Retail | Filter or group revenue and orders. |
quantity | Measure | Units on the order line | Sum across order lines. |
line_revenue | Measure | Revenue for the individual order line | Sum across order lines. |
shipping_charge | Measure | Shipping charged for the whole order | Aggregate once per order, not per line. |
This documentation is more than administrative work. It makes later SQL queries, Power BI measures, and Python analysis easier to validate and explain.
Key takeaways
A reliable analyst distinguishes four field roles:
- Identifiers label records or create links between tables. They may be numeric, but they are not quantities.
- Dimensions describe and categorise data. Use them to filter, group, and compare.
- Measures quantify business activity. Use them in meaningful calculations, while respecting the dataset grain.
- Dates place records in time and enable trends, period comparisons, and time-based filtering.
When a field appears ambiguous, ask: What does it mean in the business process, and what would a sensible analysis do with it? That question is more reliable than relying on the field’s data type alone.
Next, you will use correctly classified measures to calculate common business rates and ratios from transactional data.
Can't find a good explanation? Sign up and we'll make it for you
Sign up