
Hello. In the previous lesson, you learned to identify measures, dimensions, identifiers, and dates—and to respect the observation grain of a dataset. Those ideas now become practical: business rates and ratios are built from measures, but the calculation is only correct when its numerator and denominator refer to the right population at the right grain.
This lesson introduces a core analyst skill: calculating and interpreting metrics such as conversion rate, gross margin, average order value, share of sales, cost per acquisition, and return on ad spend from transactional data. The formulas are usually short. Defining them precisely and aggregating them correctly is the difficult, valuable part.
A rate or ratio is a relationship, not just a number
A business metric turns raw transactions into a quantity that helps someone make a decision. Total revenue tells you scale; a rate or ratio tells you something about efficiency, quality, composition, or intensity.
For example:
- Revenue: “How much did we sell?”
- Gross margin: “What proportion of revenue remains after direct costs?”
- Conversion rate: “What proportion of eligible visitors completed the desired action?”
- Average order value: “How much revenue did we receive per order?”
- ROAS: “How much attributed revenue did each advertising currency unit generate?”
Most are formed as:
The denominator gives the numerator context. A campaign with 500 purchases may sound stronger than one with 200 purchases, but not if the first campaign had 100,000 visitors and the second had only 2,000.
Before calculating any metric, write down four parts:
| Part | What to specify | Example: conversion rate |
|---|---|---|
| Numerator | What successful outcome is counted? | Unique visitors who purchased |
| Denominator | Who or what had the opportunity to produce that outcome? | Unique eligible visitors |
| Scope | Which period, market, channel, or filter applies? | India, April 2025, paid search |
| Unit and format | Is the result a percentage, currency amount, or ratio? |
This is why analysts document formulas rather than relying only on names such as “conversion” or “CAC.” Teams can use the same label while including different costs, customers, dates, or eligibility rules.
Data Analyst on How to Turn Business Metrics to Insights
Watch “Data Analyst on How to Turn Business Metrics to Insights” by Christine Jiang for a practical picture of why analysts define metrics, segment them, and connect them to action.
Watch the opening to see how stakeholder questions often begin with a metric and its movement. Then watch the framework, focusing on the need to document calculations and identify dimensions for segmentation. Finish with the campaign example, where signup volume, signup rate, and cost per signup tell different parts of the same performance story.
The central rule: aggregate first, divide second
Transactional data often has many rows per business entity. An e-commerce sales dataset may have one row per order line, even though an order can contain several products. That grain matters especially for rates and averages.
Consider this simplified order-line table:
| order_id | product category | net revenue | direct cost | quantity |
|---|---|---|---|---|
| O-1001 | Electronics | 120 | 70 | 1 |
| O-1001 | Accessories | 30 | 12 | 2 |
| O-1002 | Electronics | 100 | 55 | 1 |
| O-1003 | Accessories | 50 | 20 | 1 |
Across the reporting scope, calculate the base totals first:
There are three distinct orders: O-1001, O-1002, and O-1003. There are four rows because one order contains two lines.
Now calculate a gross margin:
The business statement is: For every 100 units of net revenue, about 47.67 remain after direct product costs.
Notice what we did not do:
Those are valid line margins, but simply averaging them would give each line equal importance even though lines have different revenue amounts. The reliable overall calculation uses total profit divided by total revenue.
For an overall business rate or ratio, calculate the aggregate numerator and aggregate denominator for the same scope, then divide.
This rule protects you from one of the most common analytical errors: averaging percentages that were calculated at a lower level of detail.
Common business rates and ratios
The following metrics appear frequently in sales, e-commerce, marketing, finance, and product analysis. Their exact definition can vary by company, so the formula should always be paired with a written business definition.
1. Share of total sales
A share answers: “What proportion of the selected total comes from this group?”
For Electronics in the example:
Accessories contribute:
The category shares add to , subject to rounding. This is an important validation check.
A share is meaningful only when the denominator is clear. “Sales share of total company sales,” “sales share within the Online channel,” and “sales share within a selected region” are different metrics because they use different totals.
2. Gross margin percentage
Gross margin indicates what remains after the direct costs of providing the product or service. In this example:
The numerator is profit; the denominator is revenue. Do not confuse it with markup, which is commonly calculated against cost:
For the same transaction, gross margin and markup are different numbers because the denominators differ. A metric label without a denominator is incomplete.
10 Business Metrics EVERY Data Analyst Must Know (Get Hired)
Watch the relevant excerpts from “10 Business Metrics EVERY Data Analyst Must Know (Get Hired)” by Christine Jiang to connect transactional calculations to the questions that sit beneath headline revenue.
Watch value per transaction for the distinction between revenue and metrics such as average order value. Then watch gross margin, focusing on why revenue growth alone is not enough and how direct costs change the interpretation.
3. Average order value
Average order value (AOV) measures revenue per order:
For the four order lines:
The denominator must be three orders, not four rows. If you divided by four, you would be calculating revenue per order line, a different metric:
Neither number is inherently wrong; the error is reporting one while intending the other.
The same reasoning applies to related metrics:
The denominator must match the entity named in the metric.
4. Conversion rate
A conversion rate is the proportion of an eligible population that completed a defined action:
Suppose an online campaign reached 10,000 unique visitors, and 420 of those visitors made a purchase:
A conversion has to be explicitly defined. It might mean:
- an email recipient opens an email;
- a website visitor submits a lead form;
- a visitor creates an account;
- a trial user becomes a paying subscriber;
- a shopper completes a purchase.
The denominator must represent the people who could reasonably complete the action. For example, an email open rate commonly uses delivered emails rather than all emails sent if some sent emails bounced.
A key validation rule follows from the usual funnel definition:
If that is not true, investigate. You may be mixing grains, counting events instead of people, or using mismatched date windows.
5. Cost per acquisition
Cost per acquisition (CPA) or customer acquisition cost (CAC) describes spending per acquired outcome:
If a campaign costs 24,000 and produces 600 qualified signups:
The result is a currency amount per signup, not a percentage.
Its definition requires care. Does “spend” mean ad-platform spend only? Does it include agency fees, employee salaries, software subscriptions, discounts, or events? The answer depends on the stakeholder’s decision, but it must remain consistent when comparing periods or campaigns.
6. Return on ad spend
Return on ad spend (ROAS) compares attributed revenue with advertising spend:
If paid-search spend was 10,000 and attributed sales were 45,000:
This is commonly expressed as 4.5:1, meaning each unit of ad spend generated 4.5 units of attributed revenue. It is not gross profit and does not include all company expenses unless the organization explicitly defines it that way.
A Complete Guide to Marketing Metrics & KPIs | 2025
Read the selected sections of CareerFoundry’s guide to see familiar examples of cost per acquisition, click-through rate, open rate, and return on ad spend. Use it to compare metric names with their numerator, denominator, and business purpose.
In the “Cost per click (CPC)” section, read the CPA discussion and identify the spend and acquisition definitions. Continue through the “Click-through rate (CTR)” and “Open rate” sections, reading the engagement metrics; focus on which audience belongs in each denominator. Finally, in the “Return on ad spend (ROAS)” section, read the ROAS explanation and note that it is a revenue-to-spend ratio rather than a profit measure.
Calculating rates safely in Excel
Excel can calculate these metrics in ordinary cells, PivotTables, or a data model. The analytical logic remains the same: totals first, division second.
If your source is an Excel Table named Sales, these formulas illustrate the pattern:
| Metric | Example formula | Important assumption |
|---|---|---|
| Total revenue | =SUM(Sales[net_revenue]) | Each row contains a line-level revenue amount. |
| Total direct cost | =SUM(Sales[direct_cost]) | Each row contains its own line-level cost. |
| Gross margin | =(SUM(Sales[net_revenue])-SUM(Sales[direct_cost]))/SUM(Sales[net_revenue]) | Revenue and costs cover the same filtered rows. |
| AOV | =SUM(Sales[net_revenue])/COUNTA(UNIQUE(Sales[order_id])) | You use a version of Excel with UNIQUE; the order ID can repeat across lines. |
| Units per order | =SUM(Sales[quantity])/COUNTA(UNIQUE(Sales[order_id])) | Quantity is line-level, while order IDs must be distinct-counted. |
Format gross margin and conversion metrics as Percentage. Format AOV and CPA as Currency. Present ROAS as a number, perhaps with a label such as 4.5x or 4.5:1, according to the organisation’s convention.
For a PivotTable, put a dimension such as product_category or channel in Rows, then add additive measures such as net_revenue and direct_cost to Values. You can calculate simple category sales shares by displaying revenue as a percentage of the grand total.
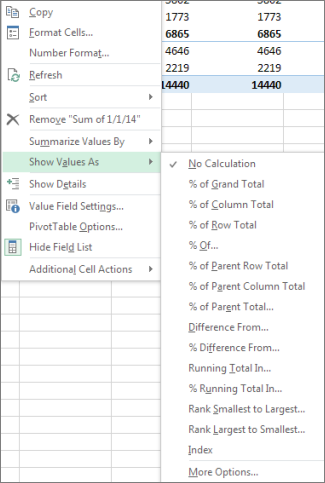
The “Show Values As” feature is appropriate for questions such as “What share of selected revenue came from each category?” It is not a general solution for every percentage. For margin, conversion, AOV, and CPA, you must explicitly use their intended numerator and denominator.
Microsoft’s example of percentage of total sales demonstrates why a row-level percent column is unsafe when filters change. A dynamic report must recompute the ratio from the relevant aggregated totals in the current report context.
When to use Calculated Columns and Calculated Fields | Microsoft Support
Read Microsoft Support’s example of percentage of total sales. It shows a common reporting mistake: summing percentages calculated separately on individual transaction rows.
In the article’s example beginning “Let’s look at another example,” read the percent-of-total case. Follow what happens after a year slicer is applied. Focus on the contrast between a fixed row-level percentage and a measure that divides the selected total by the relevant total after filtering.
Grain traps: when transactional data produces believable errors
The earlier lesson’s distinction between order-level and order-line-level data is especially important here.
Suppose shipping is 20 per order, but it is repeated on every line in an order-line extract:
| order_id | product | line revenue | order shipping charge |
|---|---|---|---|
| O-2001 | Laptop | 900 | 20 |
| O-2001 | Mouse | 25 | 20 |
Summing the order_shipping_charge column gives 40, even though the customer paid only 20. A shipping-rate calculation based on that sum would be wrong.
Before using a field in a numerator or denominator, ask:
-
What entity does this value belong to?
A line, order, customer, campaign, session, or month? -
Can it repeat because the table is at a finer grain?
An order-level field may be repeated on every line. -
Should I sum it, count it distinctly, or first reduce it to another grain?
Line revenue may be summed. Orders generally need a distinct count. Repeated order shipping may need one value per order. -
Do the numerator and denominator use the same filters and reporting period?
A March numerator divided by a January-to-March denominator is usually misleading unless that is the intentional definition.
This is also why adding percentages from rows is unreliable. A 50% margin on a 10-unit sale and a 50% margin on a 10,000-unit sale may happen to average correctly because the rates are equal—but if the rates differ, an unweighted average treats their economic importance as equal.
A compact analyst workflow
Use this routine whenever a stakeholder asks for a rate or ratio.
1. Translate the label into a definition
Replace “What is our conversion?” with something operational:
Purchase conversion rate is the percentage of unique eligible website visitors during the selected period who completed at least one purchase during that same period.
This resolves ambiguity about the action, population, time window, and uniqueness.
2. Identify the required grain
For AOV, revenue may be summed from an order-line table, but orders must be distinct-counted. For customer acquisition cost, marketing spend may be at campaign-day grain while acquisitions may be at customer grain. Know what each dataset row represents before joining or aggregating.
3. Aggregate the components separately
Calculate the numerator total and denominator total at the intended reporting scope. Segmenting by channel, region, or month is fine, but each segment must recompute both components.
4. Divide and use the correct format
- Multiply by or use percentage formatting for proportions.
- Use currency for cost-per-unit metrics.
- Use or
:1notation for return ratios such as ROAS.
5. Validate against business logic
| Metric | Fast validation |
|---|---|
| Sales share | Group shares should total approximately . |
| Conversion rate | Converters should not exceed the eligible population under the same definition. |
| AOV | AOV multiplied by distinct order count should reconstruct total revenue, allowing for rounding. |
| Gross margin | Profit should equal revenue minus direct costs. |
| CPA | Spend divided by acquisitions should reproduce the displayed CPA. |
| ROAS | Check that revenue is attributed using the same campaign scope as spend. |
Also decide what to display if the denominator is zero. In a report, a blank or “not applicable” is often more honest than an error or an infinite value. A zero denominator usually means no eligible visitors, no orders, or no spend—not necessarily zero performance.
Key takeaways
Business rates and ratios make raw transactional data decision-ready, but they depend on clear definitions:
- A metric needs an explicit numerator, denominator, scope, and unit.
- Calculate overall rates as aggregate numerator divided by aggregate denominator, not by averaging or summing row-level percentages.
- Respect dataset grain: use distinct orders for AOV when orders span multiple lines, and avoid summing order-level values repeated on transaction rows.
- A percentage share, conversion rate, gross margin, CPA, and ROAS answer different questions because their denominators differ.
- Validate each result with arithmetic checks and business constraints before interpreting it.
Next, you will compare reporting periods by calculating absolute change and percentage change—building on the same discipline of clearly defining the measure, time scope, and denominator.
Can't find a good explanation? Sign up and we'll make it for you
Sign up