
Hello again. In the previous lesson, you converted broad requests such as “analyse sales performance” into decision-focused questions with a defined metric, comparison, scope, and intended action. Before calculating that metric, you need one more piece of information: what does one row of the dataset actually represent?
That is the dataset’s observation grain (also called grain, granularity, or level of detail). It determines which calculations are valid. A sales table might contain one row per order, one row per product within an order, or one row per month. Those tables can all contain a column called sales, but they support different conclusions.
By the end of this lesson, you will be able to inspect a business dataset and state its grain clearly, such as: “Each row represents one product line on one customer order.”
Grain: the meaning of one row
The most useful question in early analysis is:
What does a single row represent?
Your answer should be a short business sentence, not merely a technical statement such as “the table has 20 columns.”
For example:
| Dataset | Clear grain statement |
|---|---|
| Online order lines | Each row represents one product line within one customer order. |
| Invoice headers | Each row represents one issued invoice. |
| Customer table | Each row represents one customer. |
| Daily sales summary | Each row represents sales for one store, product category, and day. |
| Finance budget table | Each row represents one cost-centre budget for one month. |
| Bank account snapshot | Each row represents one account’s balance at the end of one month. |
Grain is therefore the unit of observation: the real-world event, entity, or summary that each record describes.
A table at a more detailed grain contains more rows. For example, a table with one row per order line has more detail than a table with one row per order, because an order can contain several products. A monthly sales summary has less detail still, because it combines many orders into a single monthly total.
The important distinction is not whether a dataset is “big” or “small.” It is whether its rows describe individual events or summaries of many events.
Data Modeling Grain Explained | #Power BI Course 23
Watch Data Modeling – Grain Explained by Data with Baraa. It uses three sales tables to make the row-level meaning of grain concrete, then shows the calculation errors that occur when that meaning is ignored.
Watch three grains to compare order-line, whole-order, and monthly-sales tables. Then watch calculation risks, focusing on why counting repeated order IDs and summing repeated shipping charges can give incorrect results.
Use uniqueness to discover the grain
A well-formed grain usually has a set of columns that uniquely identifies each row. This may be:
- one ID, such as
customer_id; - a combination, such as
order_idandline_number; - a business entity plus a time period, such as
account_idandsnapshot_date; - several dimensions, such as
date,store_id, andproduct_id.
Consider this simplified sales extract:
| order_id | line_number | product_id | order_date | quantity | line_revenue |
|---|---|---|---|---|---|
| SO-1001 | 1 | P-14 | 2025-04-02 | 2 | 40 |
| SO-1001 | 2 | P-67 | 2025-04-02 | 1 | 25 |
| SO-1002 | 1 | P-14 | 2025-04-03 | 3 | 60 |
order_id is not unique: SO-1001 occurs twice. It would be incorrect to conclude that the row represents an order.
However, the combination of order_id and line_number is unique. The accurate grain statement is:
Each row represents one line item on an order.
This is more informative than saying “the unique key is order_id + line_number.” The key helps you test the grain; the grain explains the business meaning.
A product ID alone may not be unique either. Product P-14 appears in two different orders, which is entirely expected. A product is an attribute of an order line, not necessarily the thing represented by the row.
Understanding data grain in dbt | dbt Labs
Read Guide to data grain by Daniel Poppy at dbt Labs. It connects grain to the combination of fields that makes a row unique, including the common case where an entity becomes repeated once a time or address dimension is added.
In the opening section, read the definition and examples. Pay attention to how a table can move from “one row per user” to “one row per user and address” or “one row per user per day.” Then read the section “The importance of data grain in data modeling”, especially the modeling guidance, and note why a documented, tested key supports trustworthy analysis.
A practical inspection routine
When you first receive a spreadsheet, CSV file, or database table, use this routine before doing analysis:
- Read the table name and field names, but treat them as clues rather than proof. A table named
Orderscan still have one row per product line. - View a small sample of rows. Look for values that repeat: order IDs, customer IDs, invoice numbers, dates, and products.
- Check candidate identifiers. If an order ID repeats, investigate what distinguishes its repeated rows: product, line number, shipment, payment, or status history.
- Write one grain sentence. State what one row represents in business language.
- Identify the candidate unique key. Record the one field, or field combination, expected to be unique at that grain.
- Check whether the data follows the claim. Duplicates in the supposed key may reveal data-quality problems, an incomplete key, or a misunderstood grain.
You do not need SQL to begin this work. In a spreadsheet, sorting by order_id immediately reveals whether orders repeat. A pivot table can compare the number of rows with the number of distinct orders. Later, SQL and pandas will let you perform these checks reliably on larger datasets.
Grain is not just the primary key
A technical key such as sales_key or transaction_id may be unique, but it does not by itself tell you what a row means.
For example, a table could have a unique record_id while its rows represent:
- one item in an order,
- one shipment attempt,
- one customer support interaction,
- one payment instalment,
- one daily inventory balance.
Always pair the key with the business description:
| Candidate key | Incomplete statement | Useful grain statement |
|---|---|---|
record_id | “Each row has a record ID.” | “Each row represents one customer support ticket.” |
account_id, month_end_date | “The combination is unique.” | “Each row represents one account balance at month-end.” |
store_id, product_id, date | “Three fields identify rows.” | “Each row represents daily sales of one product in one store.” |
Why grain changes your calculations
Grain matters because business metrics have their own natural level of detail. If a measure is repeated across rows below its natural grain, blindly summing it creates double counting.
Return to the order-line table, now with a shipping amount included:
| order_id | line_number | line_revenue | shipping_charge |
|---|---|---|---|
| SO-1001 | 1 | 40 | 10 |
| SO-1001 | 2 | 25 | 10 |
| SO-1002 | 1 | 60 | 8 |
The table’s row grain is order line.
line_revenue is naturally at the order-line grain. Each value belongs to the line shown, so summing it is valid:
However, shipping_charge belongs to the whole order, not to each line. The value 10 is repeated on both lines of order SO-1001 so that the table can display it alongside every line. If you sum the column, you get 28, but the actual total shipping charged across the two orders is:
This leads to a core rule:
Before aggregating a measure, compare the measure’s grain with the table’s row grain.
Three common grain mistakes
| Business question | Incorrect approach in an order-line table | Why it fails | More appropriate approach |
|---|---|---|---|
| How many orders? | Count all rows | Rows are order lines, not orders. | Count distinct order_id. |
| What is total shipping charged? | Sum shipping_charge | One order-level charge is repeated for each line. | First obtain one shipping value per order, then sum. |
| What is average order value? | Average line_revenue | This gives average line value, not average order value. | Total revenue divided by distinct order count, or aggregate to order level first. |
For the example above, there are three line items but only two orders:
Neither number is inherently wrong. They answer different questions. The error occurs when a report labels the first number “average order value.”
The same reasoning applies to finance data. Suppose an expense table has one row per invoice line, while a monthly_budget amount is repeated on every invoice line in the same cost centre and month. Summing that budget column would multiply the budget by the number of lines. The analyst must first work at the grain where the budget is defined: typically one cost centre per month.
Grain in a sales data model
The star schema below shows a central sales fact table linked to descriptive tables for product, customer, date, address, order status, and credit card.
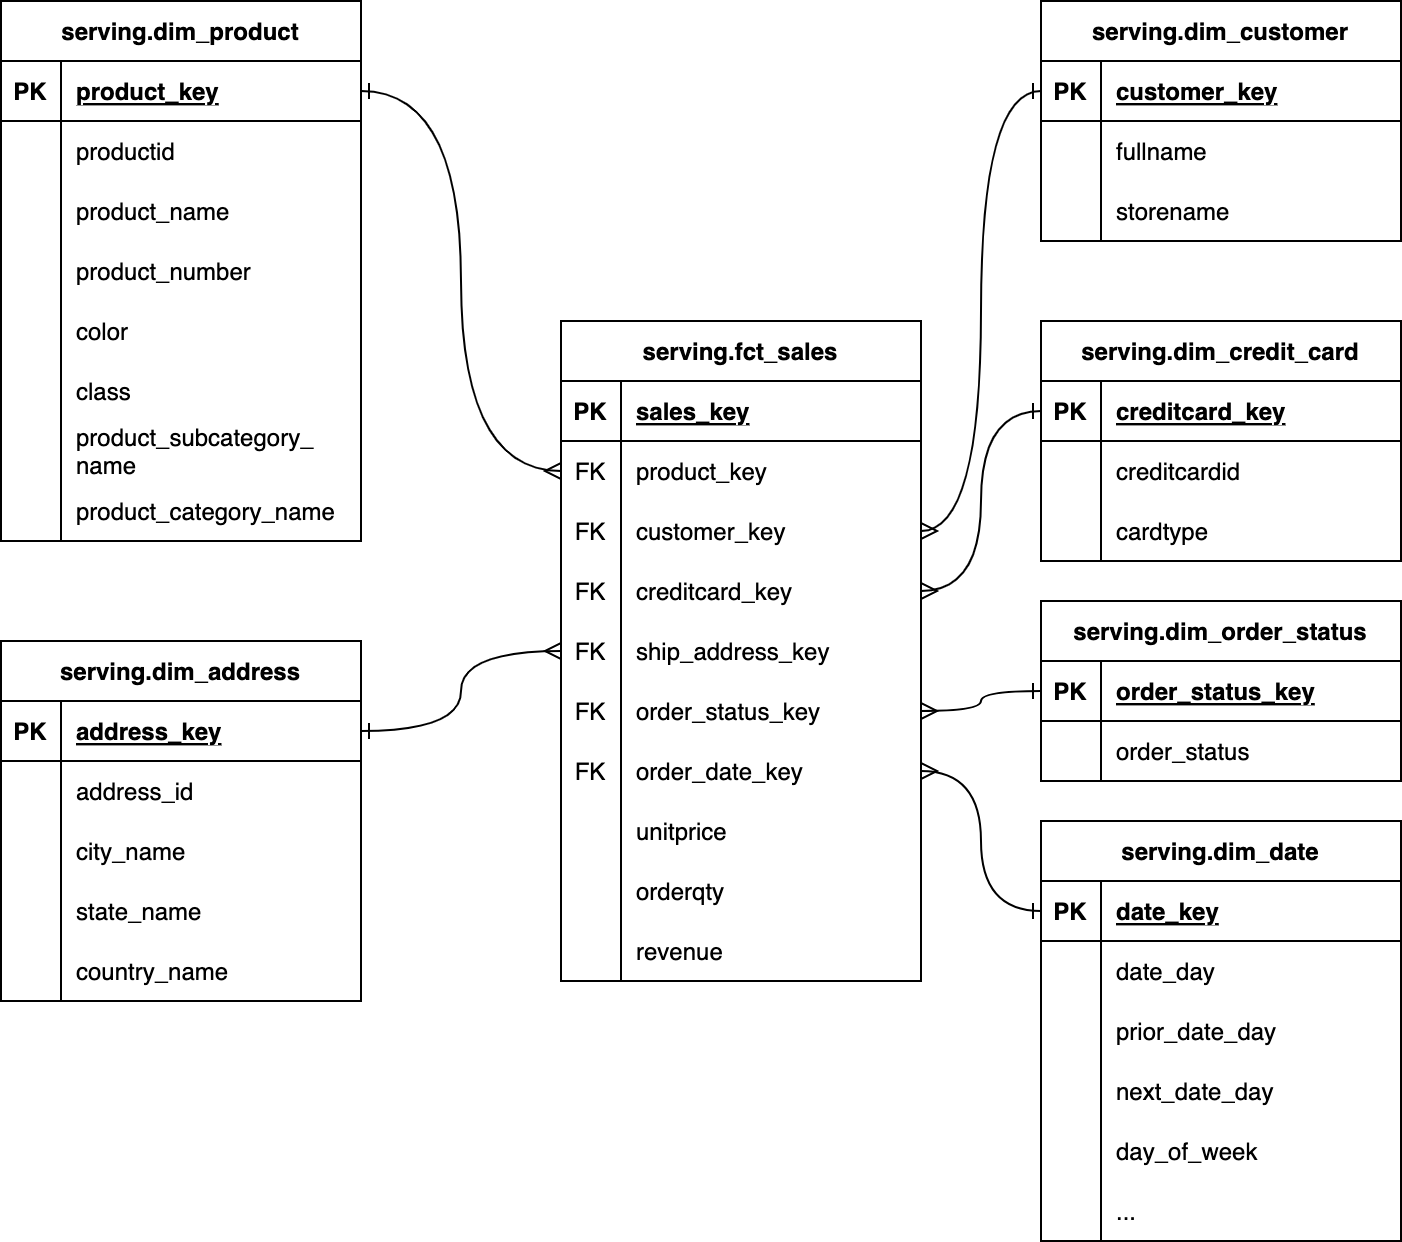
The central table includes a sales_key, several linking keys, and measures such as unitprice, orderqty, and revenue. This structure suggests that it is intended to record sales at a detailed level: a row is associated with one product, one customer, one order date, and other descriptive attributes.
Still, do not claim “one row equals one order line” from the diagram alone. Confirm it by examining the data:
- Does an order identifier repeat across multiple rows?
- Does each repeated order have different products or line numbers?
- Is
revenuethe amount for one product line or for the entire order? - Can the same product occur more than once within an order?
- Are returns, cancellations, or shipment records included as separate rows?
A schema reveals the available relationships. The data sample and business process reveal the grain.
Dimension tables also have grain. In the diagram:
dim_customeris likely one row per customer.dim_productis likely one row per product.dim_dateis likely one row per calendar day.fct_salesis likely much more detailed than any of those dimensions.
In a later SQL lesson, you will use these grain statements to decide which fields can be safely joined and to avoid multiplying sales records.
Detail, summaries, and changing grain
A dataset’s grain can change when you aggregate it.
Starting with order-line sales, a summary grouped by order_date and product_category has a new grain:
Each row represents total sales for one product category on one day.
If you then summarise by month and region, the new grain becomes:
Each row represents total sales for one region in one month.
This is useful for reporting, but it removes information. A monthly regional summary cannot tell you which individual order, customer, or product line produced the total.
This is why detailed transaction data is often valuable: you can aggregate detailed data into monthly summaries later, but you usually cannot reconstruct lost order-level detail from a monthly total.
IBM’s dimensional-modeling guidance describes grain as the level of detail associated with a record and warns against mixing different levels of detail indiscriminately within one fact table.
Dimensional modeling: Identify the grain
Read IBM’s Dimensional modeling: Identify the grain for a concise data-modeling perspective. It connects a grain definition to the level of detail available for analysis and explains why detailed data can later be aggregated, while lost detail cannot be restored.
In “Step 2: Identify the grain,” read the explanation and examples. Focus on the examples of a receipt line item, monthly account snapshot, and airline ticket: each describes a row in business terms. Then, in “Checking the atomicity of the grain,” read from the paragraph beginning “Review the atomicity” through the aggregation principle. The key idea is that detailed data can support higher-level summaries, whereas a high-level summary cannot answer lower-level questions.
Do not mix grains without making the difference explicit
A common source of unreliable reporting is a table that contains both:
- individual daily transactions, and
- a pre-calculated monthly total,
without a clear distinction between them.
If both kinds of rows are summed together, monthly sales are overstated because the monthly total already includes the transactions. The safer design is usually separate tables: one for transaction detail and another for monthly summaries. If you encounter mixed levels in a raw extract, document the issue and filter or transform deliberately before calculating metrics.
A compact grain note for every dataset
A useful analyst habit is to add a grain note to your project documentation or data dictionary. Use this template:
Table:
sales_order_lines
Grain: One product line on one customer order.
Candidate unique key:order_id+line_number.
Measures naturally at this grain: quantity, unit price, line revenue.
Measures requiring care: order-level shipping charge; it repeats across lines.
Validation: Confirm that the candidate key has no duplicates or blanks.
For a financial dataset, the note could instead read:
Table:
monthly_cost_centre_budget
Grain: One version of budget for one cost centre in one calendar month.
Candidate unique key:cost_centre_id+month_start_date+budget_version.
Notice that the second example includes budget_version. If finance keeps an original budget and a revised forecast for the same month and cost centre, then cost centre and month alone are not enough to identify a row. Grain statements become more precise as you learn more about the business process.
Before beginning any analysis, pause long enough to write this one sentence. It prevents many errors that otherwise look like reasonable calculations.
Key takeaways
The observation grain is the business meaning of one row in a dataset. State it clearly: “one order line,” “one customer,” “one account at month-end,” or “one store-product-day.”
Remember:
- Identify grain by asking what a single row represents.
- Use repeated values and candidate unique keys as evidence.
- A unique technical ID is not a complete grain definition; add the business meaning.
- The same table can contain measures at different levels of detail.
- Count, sum, and average only after checking whether the measure matches the row grain.
- Aggregation creates a new, less detailed grain.
- Document the grain and candidate key before analysing or combining a dataset.
Next, you will build on this by classifying fields in a business dataset as identifiers, dimensions, measures, or dates. That classification becomes much easier once the row’s observation grain is clear.
Can't find a good explanation? Sign up and we'll make it for you
Sign up