
Hello. In the previous lesson, you learned that reliable business metrics depend on a clear definition, the correct denominator, and the dataset’s observation grain. You also used the rule aggregate first, then divide for rates such as gross margin and conversion.
Now we add the time dimension. Analysts are rarely asked only, “What was revenue?” More often the question is: How did revenue change from last month, last quarter, or last year—and is that change meaningful? This lesson covers the two calculations needed to answer that question: absolute change and percentage change. You will also learn how to choose a valid comparison period, interpret changes in percentage-based metrics, and produce these calculations in Excel.
Two ways to describe movement over time
Suppose a business’s monthly revenue was in April and in May.
The absolute change is the raw numerical difference:
So revenue increased by 6,000 currency units.
Absolute change keeps the original unit:
- Revenue: currency
- Orders: number of orders
- Customers: number of customers
- Units sold: units
- Average delivery time: minutes or days
It answers: “How much more or less?”
Percentage change puts that movement in relation to the starting value:
When displayed as a percentage:
So revenue increased by 12%.
It answers: “How large was the movement relative to where we started?”
Both figures matter. A 6,000 increase may be material for a small business but negligible for a large one. Percentage change makes comparisons across different scales possible; absolute change preserves the real operational or financial magnitude.
Absolute Change vs. Relative Change
Watch “Absolute Change vs. Relative Change” by Math with Mister A for a concise visual explanation of why the same raw change can matter very differently when the starting values differ.
Watch the price example, which compares a one dollar increase for a low-priced coffee and a higher-priced sweater. Then watch the comparison example to see how absolute and relative changes can lead to different conclusions when comparing two investments. Focus on why the starting value is always the denominator for percentage change.
A useful reporting convention is to retain the sign in your calculation:
- Positive value: increase
- Negative value: decrease
- Zero: no change
For example, if orders fall from to :
Write this as either “orders changed by ” or, more naturally, “orders decreased by 15%.” Do not say “decreased by ,” because the word decreased already communicates the direction.
3-5: Absolute and Relative Change – Numeracy
Read this Numeracy chapter from Utah Education Network Pressbooks to reinforce the formulas with short worked examples. It is particularly useful for separating a larger raw increase from a larger proportional increase.
In the section “3-5: Absolute and Relative Change,” read the definitions at the beginning, then work through “Explore 1 – Absolute change” to “Explore 4 – Comparing absolute and relative changes.” Focus especially on the comparison conclusion: the analyst must choose the comparison that answers the stakeholder’s actual question.
Choosing the comparison period and baseline
The prior value is not simply “the other number.” It is the reference period, or baseline, against which the current period is being assessed.
Common business comparisons include:
| Comparison | Formula uses | Typical purpose |
|---|---|---|
| Month over month | This month versus previous month | Monitor recent movement |
| Quarter over quarter | This quarter versus previous quarter | Review short-term performance |
| Year over year | This month or quarter versus the same period last year | Reduce the effect of seasonality |
| Actual versus budget | Actual result versus planned result | Track performance against plan |
For a retailer, comparing December sales with November sales may show a seasonal holiday increase. Comparing December this year with December last year is often more informative because both periods reflect the same seasonal pattern.
The baseline must be stated in the final result:
Revenue in May was 56,000, up 6,000 or 12% from April.
Without “from April,” a percentage is incomplete. The reader cannot tell whether the comparison is month over month, year over year, or against budget.
A related point is that percentage changes are not symmetric. If revenue falls from to , that is a decline:
To return from to , it must then rise by :
The denominator changed. This is why every percentage change must use the intended prior-period value, not the current value or the larger value.
Reading a financial statement across reporting periods
The following financial statement provides values in millions and shows year-over-year percentage changes in the columns on the right.
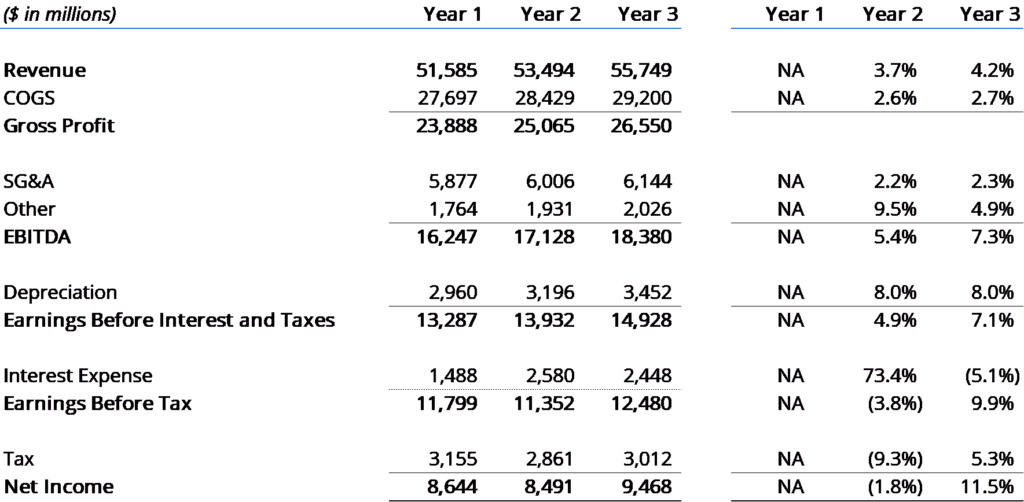
Let us calculate a few changes ourselves.
Revenue: Year 2 versus Year 1
Revenue rises from to .
Because the statement is in millions, the increase is 1,909 million.
A concise interpretation is:
Year 2 revenue increased by 1,909 million, or 3.7%, compared with Year 1.
For Year 3, revenue rises from to :
Revenue growth therefore accelerated slightly from to .
Net income: growth in revenue does not guarantee growth in profit
Net income falls from in Year 1 to in Year 2.
So although revenue grew, net income decreased by 153 million, or 1.8%. The statement also shows a large increase in interest expense during Year 2. That movement is consistent with interest expense contributing to weaker net income, but the table alone is not enough to prove a complete causal explanation.
In Year 3, net income rises from to :
A sound analytical summary distinguishes what happened from why it happened:
Revenue grew in both years. Net income declined by 1.8% in Year 2 despite revenue growth, then recovered by 11.5% in Year 3. Interest expense is a potential driver worth investigating further.
Percentage change is not always percentage points
This distinction is essential when the business measure is already a percentage, such as conversion rate, gross margin, churn rate, or return rate.
Using the financial statement, calculate gross margin for Years 2 and 3:
The direct difference is:
The correct business statement is:
Gross margin increased by 0.76 percentage points, from 46.86% to 47.62%.
It would be inaccurate to call this “a 0.76% increase.” If you specifically needed the relative percentage change in the margin itself, you could calculate:
That is mathematically valid, but it answers a different question. In operational reporting, movement in a rate is usually communicated in percentage points.
| Metric movement | Percentage-point change | Relative percentage change |
|---|---|---|
| Conversion rate: to | percentage point | |
| Gross margin: to | percentage points |
When in doubt, state the old rate and new rate explicitly. That makes the result difficult to misread.
Calculate period changes at the correct level
The aggregation principle from the previous lesson still applies. Calculate the metric for each reporting period at its intended scope, then compare the period-level results.
Imagine two regions:
| Region | Prior-period revenue | Current-period revenue | Percentage change |
|---|---|---|---|
| North | 100 | 110 | |
| South | 10 | 20 |
It would be wrong to average and and report overall business growth of . The regions have very different revenue bases.
Instead, aggregate the revenue in each period:
The South region grew rapidly in percentage terms, but the business overall grew by only . The absolute changes clarify why: North added , while South also added .
Use this workflow for any period comparison:
- Define the measure. For example, net revenue, distinct orders, gross profit, or active customers.
- Define matched reporting periods. For example, March 2025 versus March 2024 for year-over-year analysis.
- Apply the same filters and business rules to both periods.
- Aggregate the measure separately for each period.
- Calculate absolute and percentage change using the prior period as baseline.
- Check whether the result is interpretable before writing a conclusion.
Two situations need special treatment:
- Prior period equals zero: percentage change is undefined because division by zero is impossible. Report the raw change and label the percentage as blank, not applicable, or “new activity.”
- Very small prior period: a large percentage may have little business impact. An increase from to is , but it is still only additional units. Always show the absolute change beside the percentage.
If the prior-period value is negative, as can occur with net income, refunds, or returns, percentage change can become difficult to interpret. Report the actual movement clearly and confirm the stakeholder’s preferred convention before describing it as “growth.”
Producing the calculation in Excel and PivotTables
For a simple summary table, assume the prior period is in cell B2 and the current period is in cell C2.
| Result | Excel formula | Recommended format |
|---|---|---|
| Absolute change | =C2-B2 | Number or Currency |
| Percentage change | =IF(B2=0,"",(C2-B2)/B2) | Percentage |
| Percentage-point change between rates | =(C2-B2)*100 | Number with a pp label |
The percentage-change formula deliberately checks for a zero prior value. A blank is normally more honest than a divide-by-zero error or a fabricated percentage.
For example, if B2 is prior revenue of 51585 and C2 is current revenue of 53494:
=C2-B2returns1909=(C2-B2)/B2returns0.037, which Excel displays as3.70%after Percentage formatting
In a PivotTable, add the same metric to the Values area twice:
- Keep the first copy as the original amount.
- For the second copy, use Show Values As and choose Difference From for raw change.
- Use Percentage Difference From for percentage change.
- Set the relevant base field, such as Year or Month, and select Previous as the base item.
Excel Year-Over-Year and Period-Over-Period Analysis with PivotTables
Watch “Excel Year-Over-Year and Period-Over-Period Analysis with PivotTables” by Chris Menard to see how a PivotTable can display both raw period changes and percentage changes without manually copying formulas.
On a prepared PivotTable, watch absolute differences to see “Show Value As” set to “Difference From” with the previous year as the reference. Then watch percentage differences for “Percentage Difference From” and its formatting. Notice that the first reporting period is blank because it has no earlier period for comparison.
PivotTable settings make calculations faster, but they do not replace analytical judgement. Verify that the PivotTable compares the intended periods. For year-over-year monthly reporting, the goal is usually March this year versus March last year, not March versus February.
Key takeaways
Absolute change and percentage change describe the same movement from two useful perspectives:
- Absolute change is current period minus prior period and retains the measure’s unit.
- Percentage change divides that raw movement by the prior-period baseline.
- Report both values together, especially when a high percentage may come from a small base.
- Use matched periods and identical definitions when calculating month-over-month, quarter-over-quarter, or year-over-year comparisons.
- For measures already expressed as percentages, communicate the direct movement in percentage points.
- Aggregate totals within each period before calculating overall change; do not average segment-level growth rates.
- Treat zero and negative baselines carefully rather than forcing a misleading percentage.
Next, you will build on this idea of correct aggregation by learning how to calculate a weighted average for a business metric.
Can't find a good explanation? Sign up and we'll make it for you
Sign up