
Welcome. This course builds the foundations of a data analyst role on the path toward data science: first learning to frame business problems well, then preparing data, analysing it with SQL and Python, communicating results in Power BI, and eventually building a portfolio.
This opening module is about analytical thinking. Before calculating a metric or opening a spreadsheet, an analyst needs to know what decision the work is supposed to support. In this lesson, you will learn to turn a broad sales or finance request into a focused analytical question that has a clear purpose, scope, and deadline.
By the end, you should be able to hear a request such as “Can you analyse our sales performance?” and turn it into a question such as: “Which regions and product categories contributed most to the Q2 net-sales gap versus budget, so the sales director can prioritise Q3 recovery actions?”
Begin with the decision, not the dashboard
A stakeholder rarely begins with a carefully structured analytical question. They may say:
- “Sales are down. Can you pull some numbers?”
- “I need a variance report for the CFO.”
- “Can you build a dashboard for customer performance?”
- “What happened to margin last month?”
These are valid starting points, but they are requests for information or output, not yet analytical questions. A dashboard is a delivery format. A report is a delivery format. Even “sales are down” is an observation, not a decision.
The analyst’s role begins with the ask phase: defining the business problem, understanding stakeholder expectations, setting a goal, and establishing scope. The quality of this step affects every later stage. If the question is unclear, even technically flawless SQL, Python, or Power BI work can answer the wrong problem.
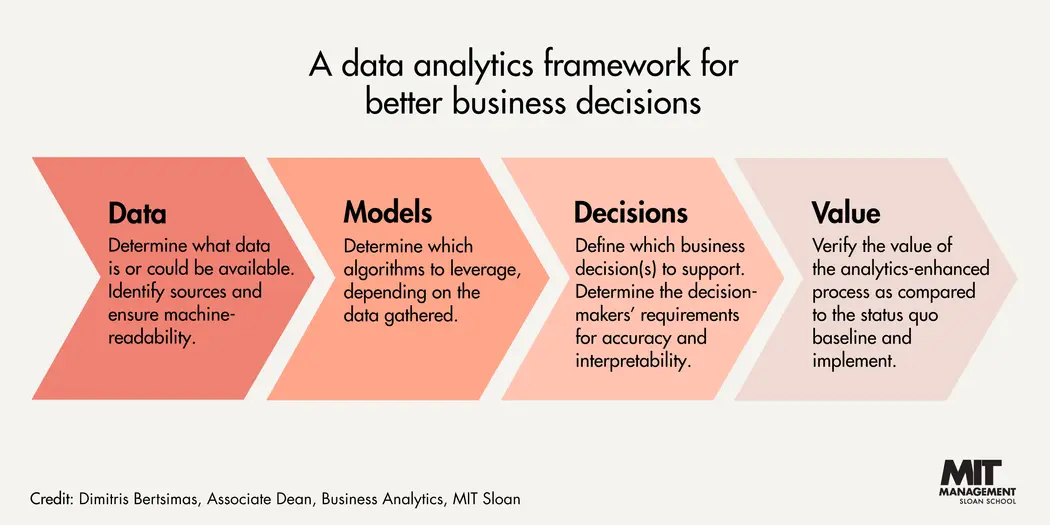
The framework in the image includes data, models, decisions, and value. When receiving a request, however, it is often productive to reason from the other end:
- What decision is someone trying to make?
- What evidence would help them make it?
- What metrics, comparisons, and segments are needed?
- What data is required to produce that evidence?
- How will the organisation know whether the decision added value?
This does not mean every analysis produces a perfect answer. It means the analysis has a purpose beyond producing attractive charts.
How to Ask the Right Questions as a Data Analyst | Google Data Analytics Certificate
Watch “How to Ask the Right Questions as a Data Analyst” from Grow with Google. It illustrates a common early-career mistake: completing a large analysis without understanding what leaders actually need to decide.
Watch the opening idea about finding the reason behind an analysis. Then watch the project mistake, where a broad request becomes an unfocused months-long effort. Finish with the reflection, focusing on how identifying drivers and possible responses would have made the work strategic rather than merely descriptive.
A useful test is to ask: “If my analysis produced two different possible findings, would the stakeholder do anything differently?”
If the answer is no, clarify the purpose before starting. If the answer is yes, you are close to a decision-focused question.
For example:
| Stakeholder request | Hidden decision |
|---|---|
| “Can you analyse sales by region?” | Where should sales leadership focus recovery efforts? |
| “Please send a monthly expense report.” | Which cost centres need intervention before the next forecast review? |
| “Show me our top customers.” | Which customers should account managers prioritise for retention or growth? |
| “Margin seems low.” | Should leaders investigate price, discounts, product mix, or costs first? |
The request tells you what someone wants to see. Your conversation needs to uncover what they need to decide.
Find the question behind the question
Stakeholders think primarily in the language of business: targets, risks, customers, budgets, deadlines, and opportunities. Analysts think in terms of data sources, measures, filters, time periods, and comparisons. Neither perspective is wrong; the analyst translates between them.
How to Handle Vague Stakeholder Requests: A Framework for Analytics Teams
Read this article from KISSmetrics for a practical framework for translating broad stakeholder requests into focused work. Its central principle is that the real request is usually a decision hidden behind a vague phrase.
In the “5-Step Translation Framework” section, read the rationale and five steps. Focus especially on the questions “What decision will this analysis help you make?” and “What would you do differently depending on what the data shows?” Notice how the article distinguishes the decision, the output format, the scope, and the timeline.
A brief clarification conversation prevents expensive rework. Start with context, rather than immediately proposing a chart or a query.
Seven clarification prompts
Use these prompts naturally; you do not need to ask all seven mechanically every time.
| What to clarify | Useful prompt | Why it matters |
|---|---|---|
| Trigger | “What prompted this request?” | The recent event often reveals the underlying concern. |
| Decision | “What decision will this help you make?” | Keeps analysis connected to action. |
| Decision-maker | “Who will use this to decide?” | Determines the audience and appropriate level of detail. |
| Metric definition | “When you say sales, do you mean orders, invoiced revenue, or net sales after returns?” | Avoids analysing the wrong business definition. |
| Comparison | “Compared with what: budget, target, prior month, or last year?” | A number has little meaning without a reference point. |
| Scope | “Which period, markets, products, or cost centres matter?” | Makes the question answerable in a sensible time. |
| Deadline and response | “When is the decision being made, and what would change your mind?” | Establishes urgency and the evidence that matters. |
Two questions deserve special attention:
What decision will this analysis help you make?
What would you do differently depending on what the data shows?
The second question is powerful because it checks whether the work can affect an action. Suppose a finance manager says, “I need to understand operating expenses.”
You might ask, “If we find one cost centre is materially above budget, what would you do?” They may answer, “I would ask that owner for a recovery plan before the forecast meeting.” Now the analysis has a clear use: identify which cost centres need follow-up, why, and by when.
Separate a decision from an output
Consider these statements:
- “We need a Power BI dashboard.”
- “We need a monthly sales report.”
- “We need insights into expenses.”
They identify a possible output, not a decision. A better starting point is:
- “The commercial director must decide where to focus Q3 recovery activity.”
- “The CFO must decide which cost centres require intervention before the forecast review.”
- “The head of sales must decide whether discounting is contributing to a margin issue.”
Once the decision is clear, then agree on the output. A one-page summary may be sufficient for a one-time forecast meeting; a recurring dashboard may be appropriate for a weekly sales-management process. Do not build the dashboard simply because the word “dashboard” appeared in the request.
Exploratory requests are legitimate
Sometimes a stakeholder cannot name an immediate decision. They may genuinely be exploring a concern: “I feel that customer quality has changed,” or “Something seems unusual in our month-end expenses.”
Do not pretend that such a request is already a tightly defined decision problem. Label it as exploratory analysis, agree on a limited time investment, and specify a useful outcome such as:
- a short list of patterns,
- a set of possible hypotheses,
- recommended next questions,
- an assessment of whether a deeper analysis is justified.
This protects both the stakeholder and the analyst from an endless “deep dive” with no agreed endpoint.
Construct a decision-focused analytical question
A strong analytical question is more than a question containing numbers. It is designed to produce evidence that helps a person choose or prioritise an action.
A practical structure is:
To support [decision] by [decision-maker] before [deadline], what does [metric] show for [business population] over [time period], compared with [baseline or target], and how does it differ across [relevant segments]?
Not every question needs every component, but this structure prevents common omissions.
The anatomy of a useful question
Suppose a sales director says:
“Sales are down. I need an analysis.”
After clarification, you learn:
- The director must choose where to focus Q3 recovery efforts.
- The concern is a Q2 shortfall against budget.
- “Sales” means net sales after returns.
- The director needs the answer before the Q3 planning meeting.
- Region and product category are the most useful ways to assign actions.
A decision-focused analytical question could be:
Which regions and product categories contributed most to the Q2 net-sales gap versus budget, and where should the sales director prioritise Q3 recovery efforts?
Notice what this version does well:
- It identifies the business outcome: net sales.
- It establishes the comparison: actual performance versus budget.
- It sets the time period: Q2.
- It specifies useful segments: region and product category.
- It names the intended decision: prioritising recovery effort.
It does not yet promise that the analysis will explain every cause or prove that an intervention will work. That restraint matters.
Avoid questions that smuggle in an unsupported conclusion
An analyst should be careful with “why” questions. For example:
“Did the new discount policy cause sales to fall?”
This assumes that a causal relationship can be established. A simple sales dataset may show that sales changed after a policy change, but other things may have changed too: seasonality, competitor actions, supply constraints, sales-team coverage, or the product mix.
A more defensible question is:
“How did net sales, units sold, and discount rates change after the new discount policy, compared with the preceding period and across regions?”
This can reveal an important pattern and guide further investigation, without claiming more certainty than the data can support.
Problem Solving with Data Analytics | Google Data Analytics Certificate
Watch “Problem Solving with Data Analytics” from Grow with Google for a concise guide to strong analytical questions. The SMART framework is helpful for checking whether a draft question is narrow enough to be answered and useful enough to inform action.
Watch weak questions to see why leading, closed, and overly broad questions limit insight. Then watch the SMART framework, focusing on specific, measurable, action-oriented, relevant, and time-bound questions. Finish with fairness, especially the warning against questions that assume an answer or steer someone toward one.
Use SMART as a quality check
SMART provides a quick test for your draft:
| Criterion | In analytics, this means | Example check |
|---|---|---|
| Specific | Focus on one decision or a tightly connected set of issues. | Is “sales performance” narrowed to a metric and business area? |
| Measurable | Use quantities that can be calculated or compared. | Can we define net sales, margin, expense, or variance? |
| Action-oriented | The finding can influence a choice, priority, or intervention. | Can a manager reasonably act differently after seeing the result? |
| Relevant | The question addresses the stakeholder’s real business concern. | Does it help with the forecast, budget, target, or customer problem at hand? |
| Time-bound | State both the period analysed and, where relevant, the decision deadline. | Are we analysing June, Q2, or the last six months? |
Also add a sixth check: fair. A fair question does not build in a conclusion.
For example, avoid:
“Which underperforming sales representative caused the revenue decline?”
This labels people as underperforming and assumes they caused the change. A neutral alternative is:
“How did net sales and conversion rates vary across sales territories in Q2 versus budget, and which areas require further investigation?”
Worked sales and finance conversions
The translation process becomes easier through repetition. Below are examples showing the movement from a vague request to a decision-focused question.
Example 1: Sales performance
Initial request:
“Can you look at sales performance for last quarter? Leadership is worried.”
Clarification conversation:
The analyst learns that leadership has a Q3 planning meeting next week. They need to decide where to focus sales recovery activity. Their target is quarterly net sales, and they need to compare actual performance with budget. Regional managers can act on specific product categories in their territories.
Decision statement:
The sales director needs to prioritise Q3 recovery efforts.
Decision-focused analytical question:
Which regions and product categories contributed most to the Q2 net-sales shortfall versus budget, and which areas should be prioritised for Q3 recovery action?
Appropriate scope note:
Analyse Q2 actual net sales versus Q2 budget by region and product category. Include returns if they are part of the agreed net-sales definition. Do not attempt to estimate the causal effect of each potential sales action without an appropriate design and data.
The scope note is not part of the analytical question itself, but it prevents later disagreement about what the work includes.
Example 2: Monthly expense variance
Initial request:
“I need a June variance report before the CFO meeting.”
Clarification conversation:
The CFO needs to decide which cost-centre owners require follow-up before the forecast review on 15 July. The relevant measure is operating expense, compared with budget. The CFO considers variance above 5% material, but wants both percentage and absolute currency variance because a small percentage on a large budget can still be important.
Decision statement:
The CFO needs to identify cost-centre owners who need to address material spending variances.
Decision-focused analytical question:
Which cost centres exceeded June operating-expense budget by more than 5% or by a material absolute amount, what expense categories drove those variances, and which owners require follow-up before the 15 July forecast review?
This is much stronger than “create a variance report.” It specifies:
- what counts as a meaningful issue,
- the comparison against budget,
- the level at which accountability sits,
- the business deadline,
- the intended action.
Example 3: Margin concern
Initial request:
“Gross margin looks weak. Please investigate.”
Clarification conversation:
The finance and sales leads need to decide whether the immediate focus should be discount discipline, product mix, return rates, or a potential cost issue. The concern is August performance compared with both budget and the same month last year.
Decision-focused analytical question:
How did August gross margin differ from budget and August last year across product categories and sales channels, and which observed driver should finance and sales investigate first?
The word observed matters. The analysis can identify the largest associated changes, such as a lower-margin product mix or higher discount rates. It should not claim a confirmed root cause unless the evidence supports that conclusion.
Confirm the agreement in writing
After the conversation, send a short confirmation. This is a professional habit that saves time and makes your work easier to defend.
A concise analysis brief can use this structure:
Decision: The CFO will decide which cost centres require intervention before the forecast review.
Question: Which cost centres exceeded June operating-expense budget by more than 5% or a material absolute amount, and what categories drove the variance?
Measures and comparison: Actual operating expense, budget, absolute variance, and percentage variance.
Scope: June results; all operating cost centres; breakdown by expense category.
Output and deadline: One-page summary with a supporting table by 14 July.
Out of scope: A full-year reforecast and causal analysis of every variance.
This written confirmation does three things:
- It checks that you and the stakeholder share the same interpretation.
- It makes scope boundaries visible before work begins.
- It gives you a reliable standard for deciding whether an extra request is part of the agreed analysis or a separate piece of work.
At this stage, you are not yet calculating rates, cleaning data, or writing SQL. You are ensuring that those later technical steps will answer a question worth answering.
Key takeaways
A data analyst does not simply respond to requests for reports, dashboards, or “insights.” The analyst identifies the decision behind the request and frames analysis to support that decision.
Remember these habits:
- Ask what prompted the request and what decision the stakeholder needs to make.
- Distinguish a business decision from an output such as a dashboard or report.
- Define the metric precisely, especially ambiguous terms such as “sales,” “revenue,” “margin,” or “expense.”
- Include a comparison, relevant segments, a time period, and a decision deadline.
- Use SMART to check whether the question is focused and answerable.
- Phrase questions fairly; do not assume a cause, blame a group, or build in the answer.
- Confirm the decision, question, scope, output, and deadline in writing.
Next, you will examine the observation grain of a business dataset: whether each row represents, for example, a transaction, an order line, a customer, or a monthly summary. That is the next essential link between a well-framed business question and trustworthy analysis.
Can't find a good explanation? Sign up and we'll make it for you
Sign up