
Good to see you again. In the previous lesson, you learned to align a business objective, the customer’s funnel stage, a platform campaign objective, and one primary KPI. That tells you what success should mean. This lesson supplies the numerical language needed to measure it.
By the end, you will be able to calculate the core metrics in a paid-campaign report: impressions, CTR, CPC, CPM, conversion rate, CPA, and ROAS. More importantly, you will be able to see how they fit together, identify which part of a campaign is weak, and avoid treating an attractive-looking metric as proof of business success.
Start with the campaign’s raw counts
A campaign report usually begins with five raw quantities:
| Raw quantity | Meaning | Example |
|---|---|---|
| Spend | Advertising cost during the selected period | £1,800 |
| Impressions | Number of times an ad was displayed | 120,000 |
| Clicks | Recorded ad clicks | 2,400 |
| Conversions | Completed defined actions, such as purchases or demo requests | 96 purchases |
| Conversion value | Revenue or another assigned value attributed to conversions | £7,680 |
The remaining metrics are ratios or unit costs calculated from those totals. This distinction matters: “2,400 clicks” tells you volume, whereas a “2% CTR” tells you how often impressions became clicks.
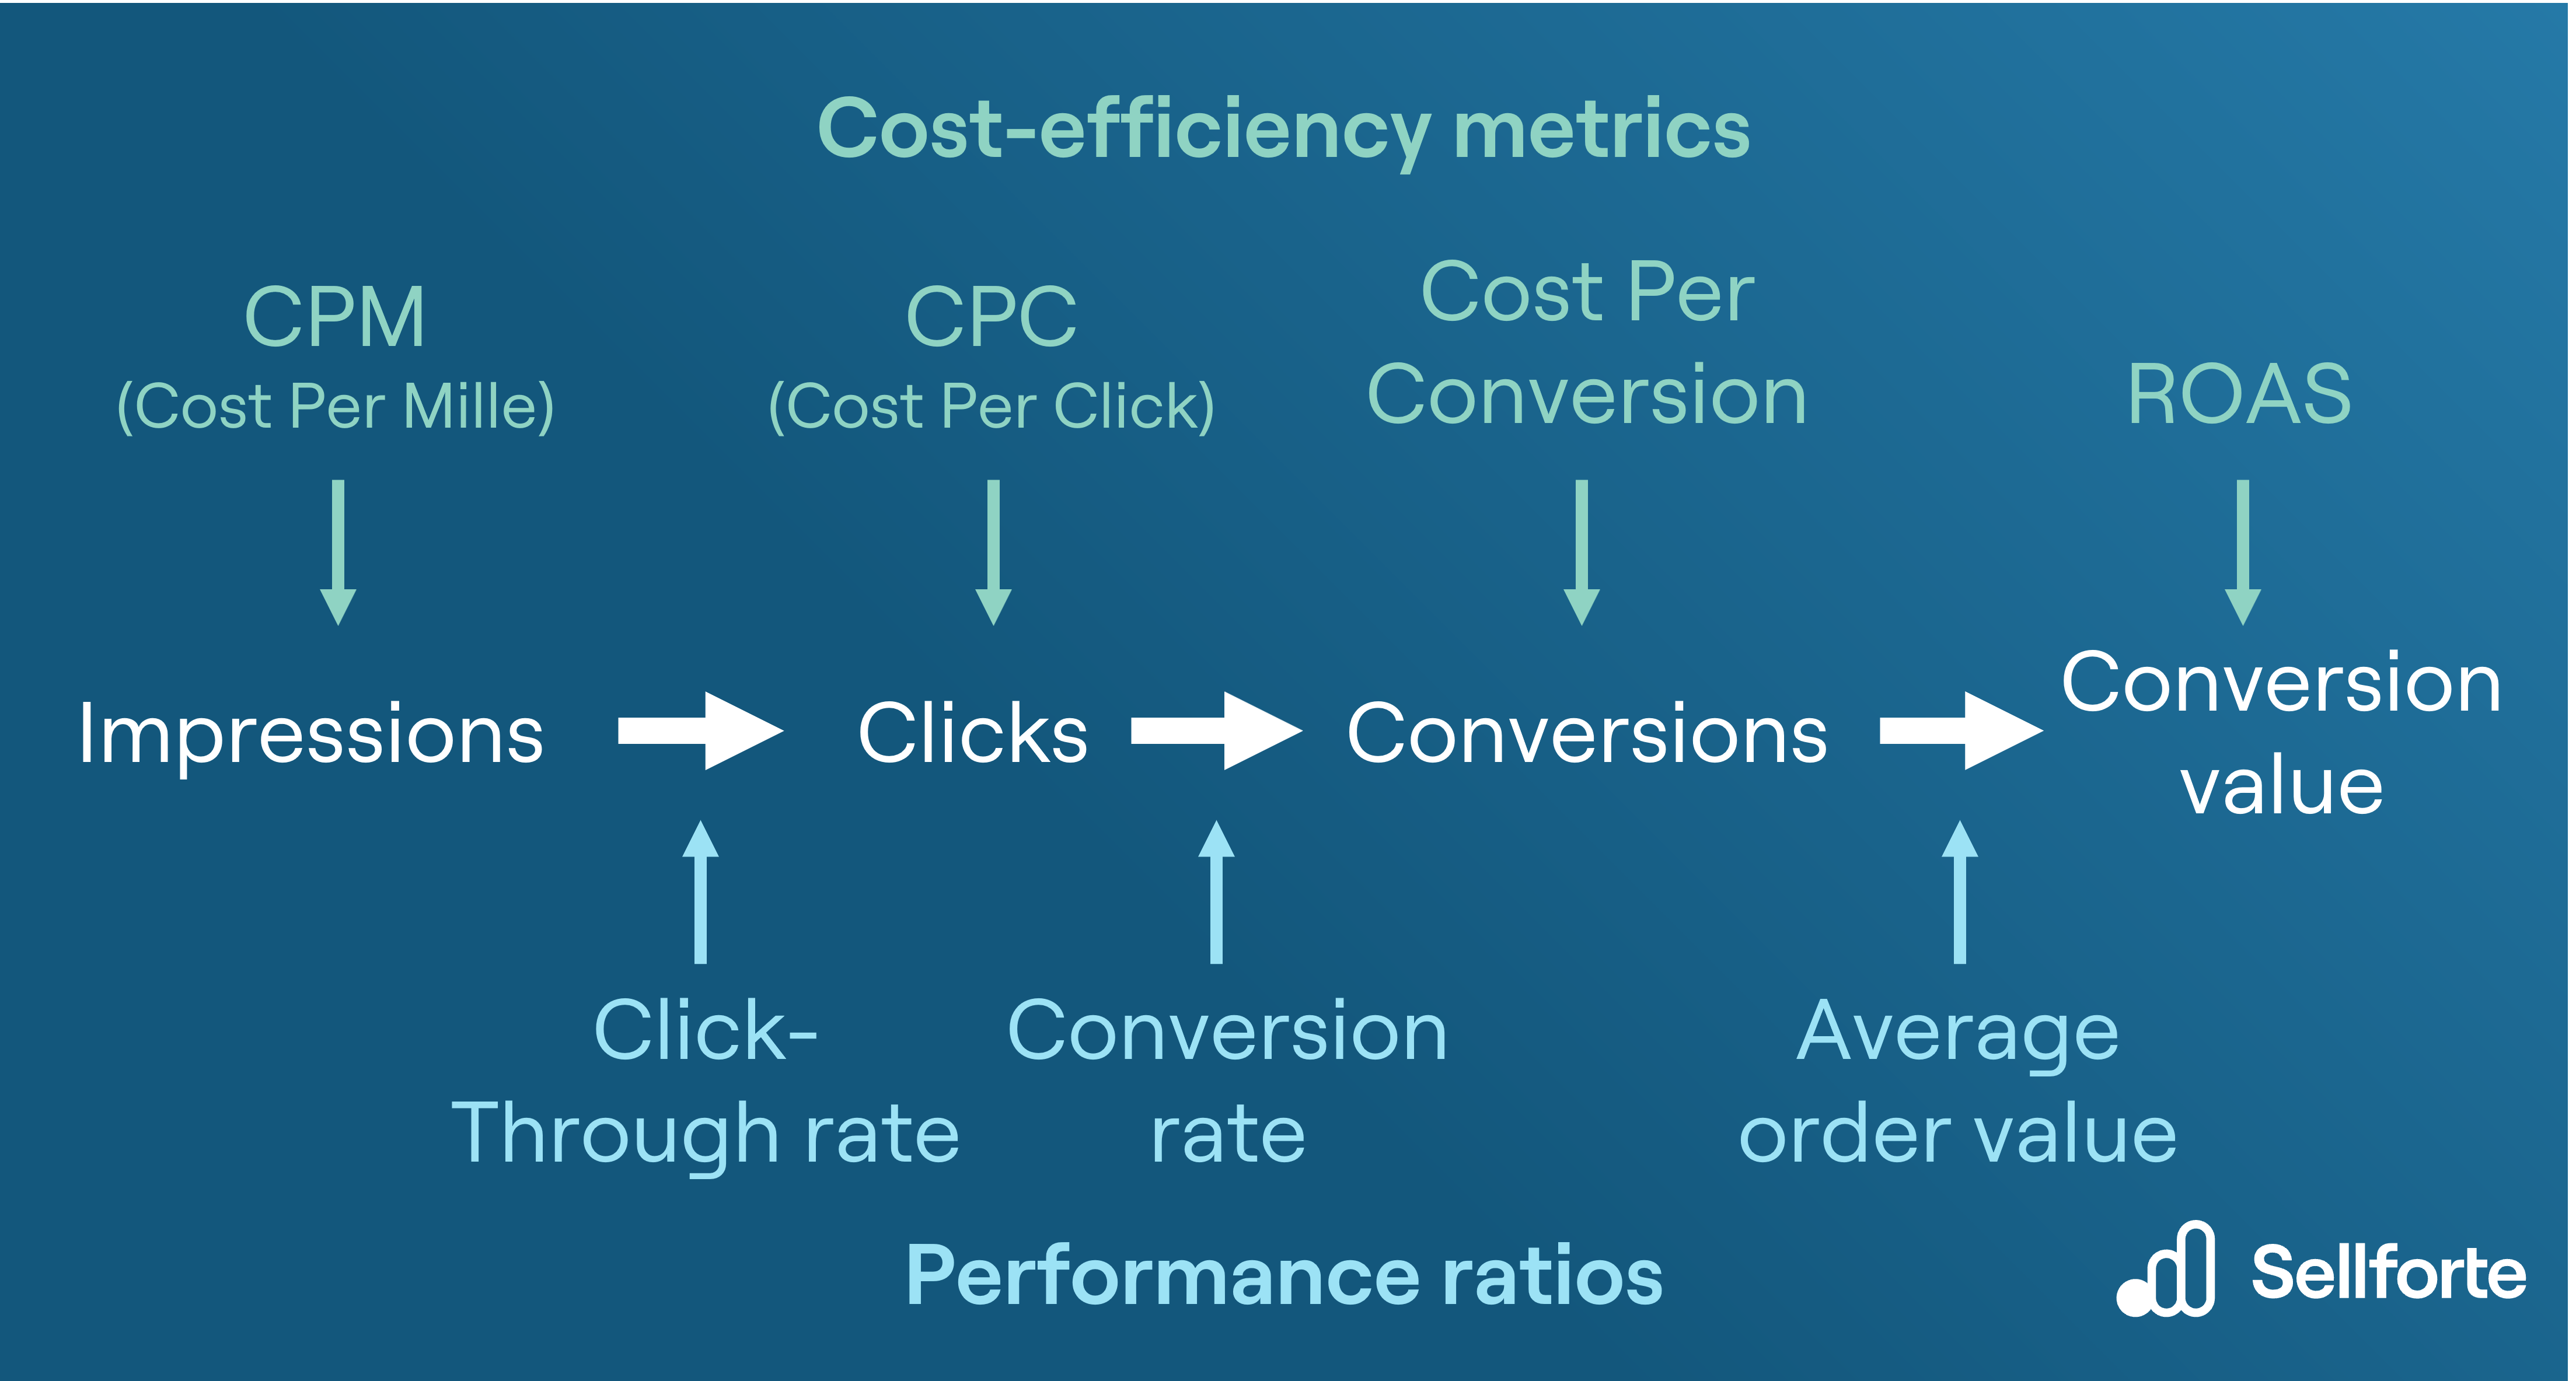
Think of the campaign as four connected stages:
| Stage | Core question | Main measures |
|---|---|---|
| Delivery | Did the platform show the ads? | Impressions, CPM |
| Response | Did people click? | CTR, CPC |
| Conversion | Did visitors take the intended action? | Conversion rate, CPA |
| Commercial return | Did conversions create sufficient value? | Conversion value, ROAS |
An impression is one display of an ad, whether or not a person notices it, clicks it, or buys. It is not the same as reach: reach counts unique people, whereas one person can create multiple impressions.
A conversion must be defined before you calculate anything. For an ecommerce sales campaign it may be a purchase. For a B2B lead campaign it may be a completed demo-request form. In a portfolio case study or interview, always state the conversion definition explicitly rather than using the term as if it automatically means a sale.
The seven essential calculations
Use the following notation:
- : spend
- : impressions
- : clicks
- : conversions
- : conversion value or attributed revenue
1. Impressions
Impressions are often supplied directly by the ad platform. If they are not, you can infer them from spend and CPM:
For example, £1,800 spent at a £15 CPM produces:
impressions.
You can also infer impressions from clicks and CTR, as long as CTR is expressed as a decimal:
If a campaign earned 2,400 clicks at a 2% CTR, use , not :
2. Click-through rate: CTR
CTR measures the proportion of displayed ads that generated a click.
A campaign with 2,400 clicks and 120,000 impressions has:
CTR is mainly a measure of ad response. It can help assess the relevance of a search keyword and ad, or the appeal of a social creative and message. But it is a diagnostic metric unless the campaign’s genuine objective is traffic: a high CTR does not guarantee conversions, revenue, or profitability.
3. Cost per click: CPC
CPC tells you the average spend required to generate one click.
For £1,800 in spend and 2,400 clicks:
The CPC is £0.75.
CPC is useful for understanding the cost of bringing visitors to a site. Low CPC is not automatically good: inexpensive clicks from an irrelevant audience can still create poor CPA and weak ROAS.
4. Cost per thousand impressions: CPM
CPM, from cost per mille, measures the cost of 1,000 impressions.
For £1,800 in spend and 120,000 impressions:
The CPM is £15.
CPM reflects the price of obtaining visibility in a particular auction, audience, placement, and time period. It is particularly relevant for awareness activity, but it also helps diagnose traffic and conversion campaigns. A higher CPM can result from competitive audiences, premium placements, seasonality, bid settings, or the platform finding more valuable users.
Basic Media Metrics Explained | CPM | CTR | CPC | CPA | CVR | Programmatic Advertising EP 8
Watch “Basic Media Metrics Explained” by Bailey Dang for a compact visual walkthrough of CPM, CTR, CPC, and CPA. It reinforces the idea that each metric describes a different stage of media performance.
Watch CPM, then CTR, CPC, and CPA. Focus on the denominator in each formula: impressions for CPM, impressions for CTR, clicks for CPC, and conversions for CPA.
5. Conversion rate: CVR
In this course, conversion rate means the percentage of ad clicks that turn into the specified conversion.
For 96 purchases from 2,400 clicks:
The conversion rate is 4%.
This metric is often abbreviated as CVR. It helps assess what happens after the click: the match between ad promise and landing page, the strength of the offer, form friction, page speed, checkout experience, and audience intent can all affect it.
Be precise about the denominator. Some reports define conversion rate against sessions, landing-page views, or even impressions. Those may be valid measures, but they are different measures. A professional report labels the denominator rather than comparing unlike figures.
6. Cost per acquisition or action: CPA
CPA is the average advertising cost required to generate one conversion.
For £1,800 in spend and 96 purchases:
The CPA is £18.75 per purchase.
You may see this described as cost per acquisition, cost per action, cost per conversion, or cost per result. The calculation is the same; the conversion definition changes. Therefore, “£25 CPA” has no useful meaning until you know whether the action was a purchase, email signup, lead, qualified lead, or booked demo.
7. Return on ad spend: ROAS
ROAS compares attributed conversion value with ad spend.
For £7,680 in tracked revenue and £1,800 in spend:
The campaign generated 4.27x ROAS. In plain language, it generated £4.27 in attributed revenue for each £1 spent on ads.
ROAS can also be reported as a percentage:
In this case:
The multiplier and percentage describe the same result:
- ROAS
- ROAS
In Google Ads, the column named conversion value divided by cost is the ROAS-style ratio.
ROAS is a revenue-efficiency metric, not a profit metric. A campaign can have positive revenue ROAS but still lose money once product cost, shipping, returns, agency fees, and overhead are considered. The next lesson will connect these metrics to the break-even thresholds that make them commercially meaningful.
One full campaign calculation
Suppose an ecommerce retailer runs a paid campaign for seven days. Its report shows:
| Metric | Result |
|---|---|
| Spend | £1,800 |
| Impressions | 120,000 |
| Clicks | 2,400 |
| Purchases | 96 |
| Purchase revenue | £7,680 |
Calculate from the top of the funnel downward, keeping the same date range and conversion definition throughout.
| Calculation | Result | Interpretation |
|---|---|---|
| 2% CTR | Two in every 100 impressions generated a click. | |
| £0.75 CPC | Each click cost 75p on average. | |
| £15 CPM | The retailer paid £15 for every 1,000 impressions. | |
| 4% conversion rate | Four in every 100 ad clicks became purchases. | |
| £18.75 CPA | Each purchase cost £18.75 in ad spend. | |
| 4.27x ROAS | Each £1 of spend generated £4.27 in attributed revenue. |
These metrics tell a coherent story only when read together. A £0.75 CPC might appear attractive, but it would be commercially weak if visitors never purchased. Similarly, £18.75 CPA looks efficient only relative to the retailer’s margin and allowable acquisition cost.
The campaign’s average order value provides a useful cross-check:
Average order value is £80. If each purchase brings £80 in revenue and costs £18.75 in advertising, then:
This relationship is extremely useful: for campaigns in which each conversion has recorded revenue, ROAS improves when average order value rises, CPA falls, or both.
How the metrics connect
The formulas are not isolated. They give you a way to trace an efficiency problem to a stage of the campaign.
First, CPC can be expressed using CPM and CTR:
Here, CTR must be a decimal. With a £15 CPM and a 2% CTR:
Holding CPM constant, a stronger CTR produces a lower CPC because the same volume of impressions produces more clicks. Holding CTR constant, a higher CPM produces a higher CPC.
Second, CPA can be expressed using CPC and conversion rate:
Again, conversion rate must be a decimal:
This explains why marketers should not optimize for click cost alone. A higher CPC campaign can still have a lower CPA if it attracts much more purchase-ready visitors and therefore converts better.
For example, compare two hypothetical campaigns:
| Metric | Campaign A | Campaign B |
|---|---|---|
| CPC | £0.60 | £1.20 |
| Conversion rate | 2% | 8% |
| CPA | £30 | £15 |
Campaign A buys cheaper clicks, yet Campaign B acquires purchases at half the cost. If both produce equally valuable purchases, Campaign B is the stronger direct-response campaign.
9 PPC Metrics to Track & How to Optimize Them
Read the relevant metric sections of Semrush’s guide to reinforce the standard dashboard definitions and formulas. The guide is useful because it distinguishes visibility, response, conversion, and return measures rather than treating all campaign columns as interchangeable.
Read the sections titled “3. Impressions” through “8. Return on Ad Spend.” In “3. Impressions,” focus on visibility. In “4. Click-Through Rate,” read the definition and relevance discussion beginning with CTR. Then read the sections “5. Cost Per Click,” “6. Conversion Rate,” and “7. Cost Per Action,” focusing especially on conversion rate and CPA efficiency. Finally, in “8. Return on Ad Spend,” use the ROAS discussion to confirm the relationship between revenue and advertising cost. Skip the optimization tips for now; later modules will treat optimization decisions in depth.
Calculate totals before comparing campaigns
Campaign reports are often segmented by channel, ad set, keyword, device, or creative. The correct method is:
- Add the raw totals for spend, impressions, clicks, conversions, and value.
- Recalculate the rate or cost from those totals.
- Do not take a simple average of displayed CTRs, CPCs, conversion rates, CPAs, or ROAS values.
Consider the same £1,800 campaign split across two channels:
| Channel | Spend | Impressions | Clicks | Purchases | Revenue |
|---|---|---|---|---|---|
| Paid Search | £1,000 | 25,000 | 1,000 | 60 | £4,800 |
| Paid Social | £800 | 95,000 | 1,400 | 36 | £2,880 |
| Total | £1,800 | 120,000 | 2,400 | 96 | £7,680 |
Paid Search has a £16.67 CPA:
Paid Social has a £22.22 CPA:
It would be wrong to calculate overall CPA as the simple average:
The correct total CPA uses total spend and total purchases:
The difference occurs because the channels did not generate the same number of conversions. The total calculation automatically weights each channel according to its actual contribution.
This principle applies to every ratio:
- Overall CTR uses total clicks divided by total impressions.
- Overall CPC uses total spend divided by total clicks.
- Overall conversion rate uses total conversions divided by total clicks.
- Overall ROAS uses total revenue divided by total spend.
A spreadsheet, ad dashboard, or BI tool can calculate these automatically, but knowing the underlying structure lets you audit the numbers instead of merely copying them.
Interpret metrics without falling into common traps
There is no universally “good” CTR, CPC, CPA, or ROAS. A reasonable result depends on the product price, margin, market competition, channel, audience, country, campaign objective, attribution rules, and stage of the funnel.
Use metrics as evidence in context.
A low CPC is not the same as efficient acquisition
Suppose a broad social campaign buys clicks cheaply but generates low-intent visitors. It may report a low CPC and a weak conversion rate, producing a poor CPA. Search traffic for a specific high-intent query may cost more per click but convert at a much better rate.
For a purchase campaign, CPA and ROAS are closer to the business outcome than CPC. CPC helps diagnose why CPA changes; it should not automatically become the optimization target.
A high CTR is not proof of sales performance
CTR is especially helpful for examining ad relevance and creative response. But sensational, ambiguous, or overly broad ad copy can generate clicks from people with little intent to buy. A high CTR paired with a poor conversion rate may indicate a mismatch between the ad’s promise, the audience, and the landing page.
A low CPA can hide low-quality conversions
A lead form with few qualification checks may generate inexpensive submissions. If sales rejects most of them, the raw lead CPA overstates performance. When possible, calculate toward a deeper outcome such as accepted lead, booked meeting, sales-qualified lead, or closed customer.
ROAS needs reliable conversion value
ROAS is meaningful only if the conversion value represents something the business agrees is valuable. For ecommerce, this is often purchase revenue. For lead generation, a platform may assign a value to a lead, but that value should be based on a documented business assumption, not an arbitrary number selected to make reporting look strong.
Zero conversions require a different treatment
If a campaign has spend but no conversions:
- Conversion rate is .
- ROAS is , if it has no conversion value.
- CPA is undefined, because dividing spend by zero conversions is impossible.
In a report, show CPA as “—”, “N/A,” or “No conversions,” not £0. A £0 CPA would mean free conversions, which is the opposite of what occurred.
A disciplined calculation checklist
Before presenting performance metrics, check the following:
- Same scope: Use the same date range, campaign selection, currency, and attribution setting for numerator and denominator.
- Clear conversion definition: State whether conversion means a purchase, lead, signup, demo, or another event.
- Raw totals first: Aggregate spend, impressions, clicks, conversions, and revenue before calculating summary rates.
- Correct percentage handling: Multiply by 100 only when presenting CTR or conversion rate as a percentage. Use decimals, such as and , inside relationship formulas.
- Consistent ROAS format: Label it as either or ; do not mix the two without explanation.
- Avoid premature conclusions: Compare results with the campaign’s target and business economics, not with a vague idea that “lower cost” is always better.
Key takeaways
The core performance-marketing metrics describe a campaign from exposure to commercial value:
- Impressions count displays of an ad.
- CTR measures clicks relative to impressions.
- CPM measures cost per 1,000 impressions.
- CPC measures cost per click.
- Conversion rate measures conversions relative to clicks.
- CPA measures advertising cost per conversion.
- ROAS measures attributed conversion value relative to advertising spend.
The most valuable habit is to read them as a connected system. CPM and CTR help explain CPC; CPC and conversion rate help explain CPA; average order value and CPA help explain ROAS. For direct-response campaigns, the final judgment should normally centre on CPA or ROAS, provided the conversion and value data are trustworthy.
Next, you will calculate break-even CPA and break-even ROAS from price, margin, and conversion assumptions. That is the step that turns a campaign metric into a defensible financial target.
Can't find a good explanation? Sign up and we'll make it for you
Sign up