
Hello! Welcome back to our fourth module on Incrementality and True Marketing Impact.
In our last lesson, we focused on interpreting the results of incrementality tests. We established that the key is to look for a statistically significant causal lift, paying close attention to confidence intervals and p-values to ensure you're acting on a true signal, not random noise. We also introduced Incremental ROAS (iROAS) as a critical output metric.
Today, we're going to put iROAS under the microscope. Our learning outcome is to compare incremental ROAS (iROAS) to platform-reported ROAS and explain the strategic implications of the difference. As someone with deep experience running campaigns on Meta and Google, you're intimately familiar with the ROAS figures those platforms report. This lesson will equip you to challenge those numbers, understand the truer picture of performance, and make smarter, more profitable strategic decisions as a result. This is one of the most significant shifts in mindset from a channel operator to a strategic marketing leader.
1. Defining the Two Metrics: Attributed vs. Causal Return
At a glance, both metrics seem to measure the same thing: return on ad spend. However, they are calculated differently and tell fundamentally different stories.
Platform-Reported ROAS is the metric you see every day in your ad dashboards. It's a measure of attribution.
This calculation relies on the platform's attribution model (e.g., last-click, 7-day click) to take credit for a conversion. It answers the question: "Of the people who converted, how much revenue came from those who interacted with my ads according to the platform's rules?"
Incremental ROAS (iROAS), which we touched on last lesson, is a measure of causality.
Here, "Incremental Revenue" is the value generated only from conversions that would not have happened without the ad campaign, as determined by an incrementality test. It answers a more powerful question: "How much additional revenue did my ad spend generate for the business?"
To solidify these definitions and see their formulas, let's turn to a helpful article.
Understanding Incremental ROAS vs ROAS for Marketers
The article 'Understanding Incremental ROAS vs ROAS for Marketers' from INCRMNTAL clearly lays out the distinction between these two metrics.
Please read the following sections: 'What is Incremental ROAS?', 'The difference between ROAS and Incremental ROAS', 'ROAS calculation', and 'Incremental ROAS Calculation (iROAS)'. Focus on how iROAS measures the 'true contribution' and how standard ROAS assumes the ad is solely responsible for the revenue.
The core takeaway is this: Platform ROAS measures correlation, while iROAS measures causation. A high platform ROAS doesn't necessarily mean a high impact on overall business growth.
2. Why is There a Gap? Unpacking the Discrepancy
If platform ROAS is, for example, 4.0x, why might the iROAS be only 1.5x? The difference between these two numbers is where millions of dollars in marketing budgets are either used effectively or wasted. Understanding the "why" is key to your strategic role.
The gap primarily comes from one place: Platform ROAS takes credit for sales that would have happened anyway. Here are the main reasons this occurs:
- Cannibalization: This is the most common culprit. A paid ad gets credit for a sale that would have occurred through another channel. Your experience with SEO is highly relevant here. A classic example is branded search ads. A user searches for your brand name, clicks a paid ad, and converts. The platform reports a very high ROAS. But would that user, who was already searching for your brand, have clicked the organic link just below it and converted anyway? Almost certainly. The paid ad cannibalized an organic conversion.
- Platform Incentives & Biases: Ad platforms are graded on the performance they report. They are fundamentally incentivized to attribute as many conversions as possible to the ads running on their platform. They have a biased, channel-centric view of the world.
- Customer Journey Effects: A user sees your ad on Instagram but doesn't click. Two days later, they remember your brand, type your URL directly into their browser, and make a purchase. Many attribution models would miss the influence of the Instagram ad, but in some cases, view-through attribution might claim credit, further muddying the waters. iROAS, by comparing against a control group, isolates the true persuasive effect of the ad.
Let's look at a concrete example of how this plays out.
Understanding Incremental ROAS vs ROAS for Marketers
The same article provides a simple but powerful numerical example illustrating the gap between reported and actual impact.
Read the section that begins 'Here is a simple example:'. Note the difference between the campaign's reported revenue ($150,000) and the actual increase in total company sales ($70,000). This highlights the core problem.
In that example:
- Platform ROAS: $150,000 / $50,000 = 3.0x (Looks good!)
- iROAS: $70,000 / $50,000 = 1.4x (A much more sober, and accurate, picture)
A leader acting on the 3.0x number would scale up spend, potentially wasting money. A leader acting on the 1.4x number would ask tougher questions about profitability and efficiency.
The following article has an excellent visualization of this problem.
How to Calculate Incremental Revenue & ROI
The article 'Calculating Incremental Revenue (ROI)' shows what can happen when you add a new channel that seems efficient but is actually cannibalizing existing efforts.
Please read the sections 'How to Calculate Incremental ROI to Make Better Marketing Decisions ?' and 'Challenges With Marketing ROI'. Pay close attention to the two graphs. The first shows the 'New Vendor' having a great ROAS. The second shows that despite this, the company's overall new customer acquisition has actually become less efficient.
This example, with its "New Vendor" cannibalizing other channels, perfectly illustrates the danger of looking at channel metrics in a silo. As a leader, your focus must be on the second graph: the total business impact.
3. Strategic Implications: From Metrics to Money
This is where the analysis connects to your role as a leader. What do you do with this information? The discrepancy between platform ROAS and iROAS has direct implications for your most important responsibilities: budget allocation and demonstrating marketing's value.
Look at the dashboard below. This is the type of report a strategic leader should be reviewing. It moves beyond single-channel vanity metrics to a holistic, causal view of performance.
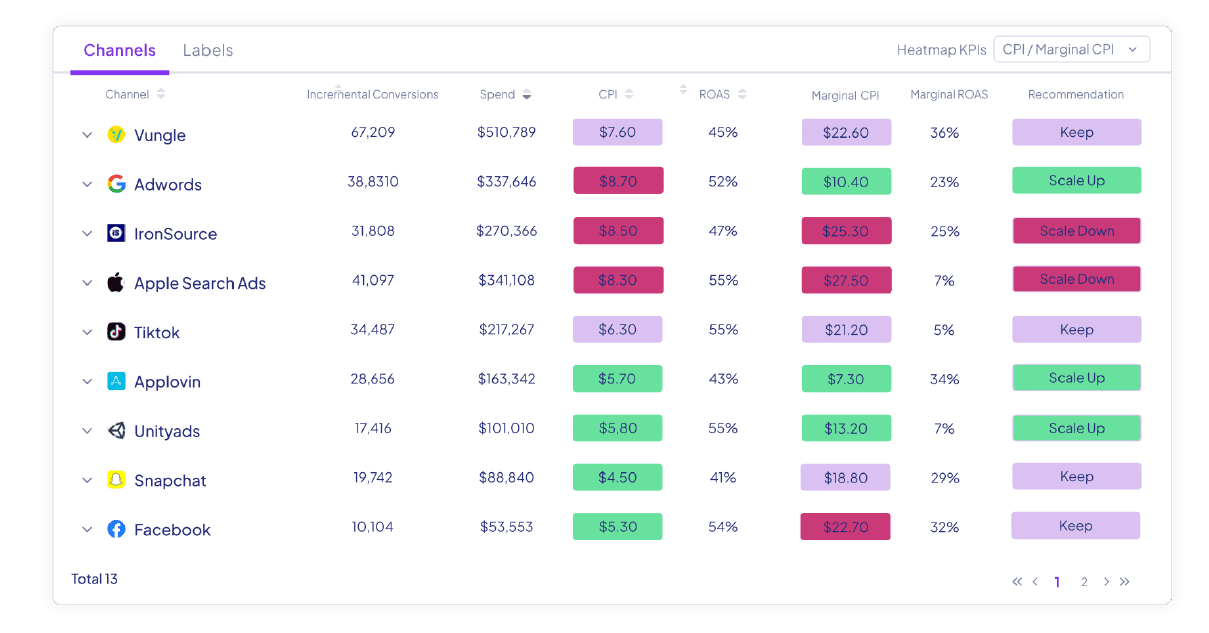
Let's analyze this dashboard as if it landed on your desk:
- Evaluating True Channel Performance: Look at 'Adwords'. It has a good reported ROAS of 3.82. However, its 'Marginal ROAS' (iROAS) is only 1.25. This channel is taking credit for a lot of conversions that would have happened anyway. In contrast, look at 'Tiktok'. Its reported ROAS is lower at 2.94, but its Marginal ROAS is a very strong 2.91. TikTok is delivering highly incremental customers.
- Informing Budget Allocation: The 'Recommendation' column is the strategic output.
- For Adwords, the recommendation is to 'Scale Down'. Despite the attractive platform ROAS, it's not an efficient driver of growth.
- For TikTok, the recommendation is 'Scale Up'. This channel is delivering true incremental value, and there's an opportunity to invest more to grow the business.
- For 'Facebook', the Marginal ROAS is negative (-0.51), indicating the spend is actively destroying value (likely through high costs and heavy cannibalization). The recommendation is an urgent 'Scale Down'.
Acting on platform ROAS would lead you to invest more in Adwords and less in TikTok. Acting on iROAS leads you to the correct, and opposite, conclusion.
Test your understanding!
Your team presents you with the following data for Q3 performance:
- Meta Ads (Retargeting Campaign):
- Spend: $200,000
- Platform-Reported ROAS: 10.0x
- Incremental ROAS (from a lift test): 1.8x
- YouTube Ads (Prospecting Campaign):
- Spend: $200,000
- Platform-Reported ROAS: 3.5x
- Incremental ROAS (from a geo-lift test): 3.2x
You have an extra $50,000 in your budget for Q4.
- Which campaign is the better candidate for the additional investment? Why?
- How would you explain this decision to your CFO, who might only see the 10.0x ROAS from Meta and question why you aren't putting more money there?
Show answer
-
Investment Decision: The YouTube Ads campaign is the clear winner for the additional $50,000. While Meta's platform ROAS is much higher, its incremental return is low (1.8x). This suggests it's mostly capturing users who would have converted anyway (e.g., existing customers). The YouTube campaign's iROAS (3.2x) is nearly identical to its platform ROAS, indicating it is efficiently generating new, incremental revenue for the business. Every additional dollar spent on YouTube is likely to return $3.20 in true growth.
-
Explanation to the CFO: "I understand why the 10x ROAS on the Meta report looks impressive. However, that number is an attribution metric that includes a lot of revenue we would have captured regardless. Our experiments show that for every dollar we spend on that campaign, we only generate $1.80 in truly new revenue. In contrast, the YouTube campaign is proving to be a powerful growth engine. For every dollar we invest there, we generate $3.20 in new revenue that we would not have seen otherwise. By allocating this extra $50,000 to YouTube, we are investing in causal growth for the business, not just retargeting existing-intent customers. This will maximize the overall return on our marketing budget."
Conclusion
Understanding the chasm between platform-reported ROAS and incremental ROAS is not just a technical exercise; it's a strategic imperative. It's the key to unlocking efficient growth and demonstrating the true value of your marketing organization.
Key Takeaways:
- ROAS is an attribution metric; iROAS is a causal metric. Platform ROAS measures correlation within a channel, while iROAS measures the ad's causal impact on the entire business.
- The gap is driven by non-incremental factors, chiefly the cannibalization of organic or direct conversions.
- Strategic decisions must be based on iROAS. Allocating budget based on platform ROAS often leads to investing in channels that aren't actually growing the business.
- As a leader, your role is to shift the conversation and the measurement focus from attributed, channel-siloed returns to holistic, incremental business impact.
Preview of the Next Lesson:
We've now established why iROAS is the superior metric for strategic decision-making. In our next lesson, we will get even more practical and focus on the "how." The learning outcome is to apply incrementality insights to make strategic budget allocation decisions between channels. We will build on today's concepts to create a framework for optimizing your entire marketing portfolio based on causal data.