
Hello! Welcome to the next lesson in your study of Medical Instrumentation.
In our last session, we focused on analyzing the brain's ongoing or spontaneous activity by creating qEEG topographical maps. This is excellent for understanding general states like arousal or relaxation. But what about the brain's reaction to a specific, fleeting event—like a warning notification on your Neuraease device, or a user recognizing a specific facial expression? These rapid, event-locked responses are too small and too brief to be seen in a qEEG map.
This lesson tackles that challenge directly. Our learning outcome is to: Describe the process of averaging to extract event-related potentials (ERPs) from raw EEG data. We will move from analyzing the brain's background state to isolating its precise response to a stimulus. This technique is fundamental to cognitive neuroscience and is a powerful tool for investigating how the brain processes information in real-time.
1. The Challenge: Finding a Whisper in a Thunderstorm
An Event-Related Potential (ERP) is a tiny, stereotyped voltage change in the EEG that is directly triggered by a sensory, cognitive, or motor event. For example, when you see a face, your brain produces a specific ERP waveform. The problem is that this ERP signal is incredibly small, typically only a few microvolts (). It's completely buried within the ongoing background EEG, which is much larger (often 20-50 or more).
In the context of ERPs, this large, ongoing EEG activity is considered "noise" because it's not related to the specific event we want to study. Our task is to pull the faint ERP "signal" out of this overwhelming background "noise."
To get a feel for this challenge and the clever solution, watch the following short video from MIT's Center for Brains, Minds and Machines. The analogy of listening for a specific sound from outside a football stadium is particularly fitting.
2.9 - Event-Related Potentials (ERPs)
This video introduces the core problem of weak ERP signals being hidden in noisy EEG data and presents the fundamental idea of signal averaging as the solution.
Watch the segment from 03:07 to 05:16. Focus on the central idea: why you can't see the response in a single trial and how repeating the event and averaging the data helps the consistent signal emerge from the random noise.
As the video explains, the key is that while the noise is random, the brain's response to the event is consistent and "phase-locked" (or time-locked) to the stimulus. This is the crucial insight we will exploit.
2. The Solution: The Signal Averaging Process
Signal averaging is the workhorse technique used to extract ERPs. It operates on two key assumptions:
- The Signal is Constant: The ERP elicited by the event is assumed to have a consistent shape and timing (latency) on every trial.
- The Noise is Random: The background EEG activity is not time-locked to the event and its voltage at any given post-stimulus moment will vary randomly between positive and negative across trials.
When we average many trials together, the random positive and negative noise values tend to cancel each other out, approaching zero. The constant ERP signal, however, does not cancel out and emerges from the averaged data.
The process involves several distinct steps:
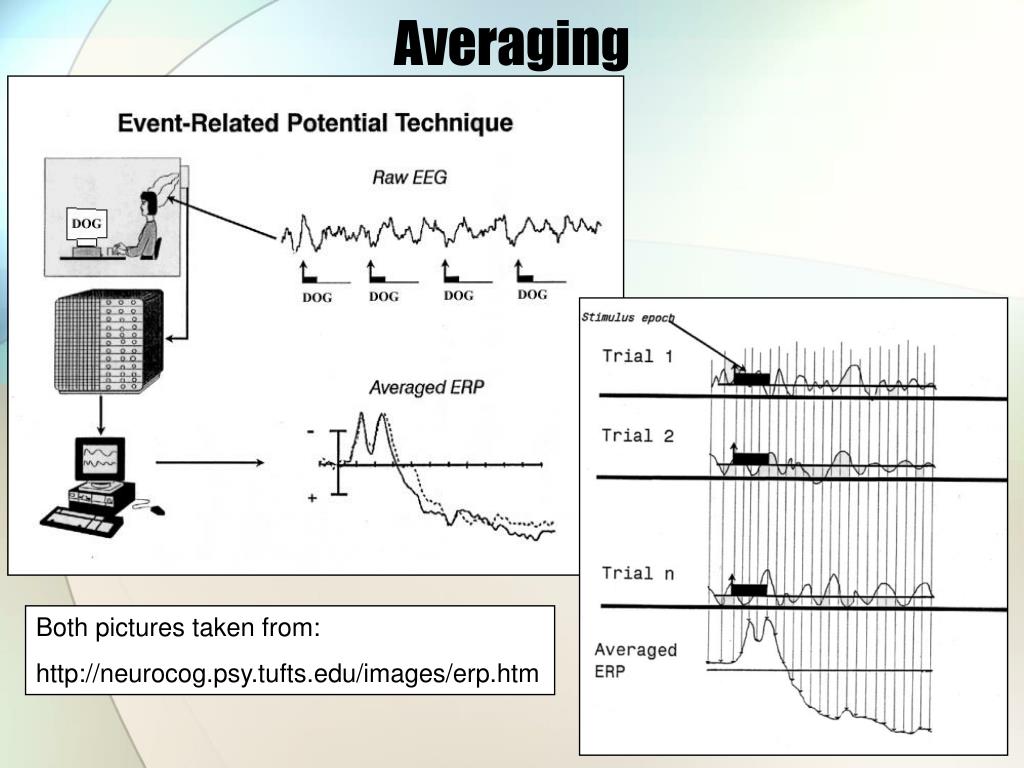
The following reading from the journal The Quantitative Methods for Psychology provides a detailed, technical breakdown of these steps.
The Recording and Quantification of Event-Related Potentials: II. Signal Processing and Analysis
This paper provides a clear, step-by-step guide to the signal processing involved in extracting ERPs. We will focus on the core mechanics of the process.
Please read two sections from this paper. Start with the section 'Segmentation & Baseline correction'. This explains how continuous EEG is chopped into epochs and why correcting for baseline drift is important. Then, read the section 'Signal Averaging' very carefully. This is the heart of today's lesson. Pay close attention to Figure 5, which brilliantly illustrates how the signal-to-noise ratio improves as more trials are added to the average.
Let's briefly summarize the key steps from that reading:
- Epoching (Segmentation): The continuous EEG recording is sliced into small segments, or "epochs." Each epoch is time-locked to a stimulus, typically starting about 100-200 ms before the stimulus and extending for about 1000 ms (1 second) or more after it.
- Baseline Correction: The pre-stimulus period in each epoch serves as a baseline. The average voltage during this period is calculated and subtracted from the entire epoch. This removes slow voltage drifts and ensures that the pre-stimulus activity is centered around 0 µV.
- Artifact Rejection: Any epochs contaminated by large non-brain signals (like eye blinks or muscle tension) are identified and removed from the dataset so they don't distort the average.
- Averaging: All the clean, baseline-corrected epochs for a given condition are aligned at time-zero (the stimulus onset) and averaged together, point by point. The result is the averaged ERP waveform.
The process is also clearly illustrated in Figure A1.3 of the Applied Event-Related Potential Data Analysis textbook, which you can find in the resource titled "A Very Brief Introduction to EEG and ERPs" (ID: LINK). It provides a slightly different visualization of the same core concept.
3. The Math of Improvement: Signal-to-Noise Ratio (SNR)
The most important quantitative aspect of signal averaging is how effectively it reduces noise. As mentioned in the paper, the amplitude of the random noise decreases as a function of the square root of the number of trials ().
This has a critical practical implication: to halve the noise (and thus double the signal-to-noise ratio), you must quadruple the number of trials.
For your work at Neuraease, this is a vital trade-off. To get a clean ERP signal from a wearable device user, you need many trials. However, presenting hundreds of stimuli can be tedious and lead to fatigue or boredom, which in itself changes the brain state you're trying to measure. Designing efficient and engaging ERP experiments is a major challenge in applied neuroscience.
Test your understanding!
Suppose you are designing an experiment for Neuraease to measure the brain's "surprise" response to an unexpected sound. You find that in a single trial:
- The ERP signal of interest (the "surprise" potential) has an amplitude of 3 µV.
- The background EEG noise has an RMS amplitude of 21 µV.
- What is the signal-to-noise ratio (SNR) in a single trial?
- You decide you need an SNR of at least 1.0 for the signal to be reliably detected. How many trials () would you need to average to achieve this?
Show answer
-
Single-trial SNR:
The signal is much weaker than the noise.
-
Trials needed for SNR = 1.0:
We want the new noise level to be equal to the signal level (3 µV). We use the formula for noise reduction:We set to our target of 3 µV:
Now, solve for :
Finally, square both sides to find :
You would need to average approximately 49 trials to achieve an SNR of 1.0, where the signal and the residual noise have about the same amplitude.
Conclusion
Today, we've focused on the foundational technique for studying the brain's direct responses to events. You've moved beyond analyzing the brain's continuous state to learning how to isolate the specific, tiny signatures of cognitive processing.
Key Takeaways:
- Event-Related Potentials (ERPs) are small, event-locked voltage changes in the EEG, which are typically hidden by larger background brain activity ("noise").
- Signal averaging is the primary method to extract the ERP signal from the noise.
- The process relies on the assumptions that the signal is consistent across trials and the noise is random.
- The core steps are epoching, baseline correction, artifact rejection, and averaging many trials.
- The signal-to-noise ratio improves with the square root of the number of trials, creating a crucial trade-off between signal quality and experiment duration.
Preview of the Next Lesson:
Now that you know how to extract an ERP waveform, you're ready to ask: What do these waveforms mean? In our next lesson, we will begin to analyze specific ERP components (e.g., P300, N400) in the context of cognitive tasks. We'll learn to read the bumps and troughs of the averaged waveform and connect them to distinct cognitive functions like attention, surprise, and language processing.
Can't find a good explanation? Sign up and we'll make it for you
Sign up