
Hello! Welcome back to your course on Medical Instrumentation.
In our last lesson, we established a powerful method—signal averaging—to pull a clean Event-Related Potential (ERP) waveform out of noisy EEG data. We went from a chaotic signal to a clear, repeatable brain response. But a clean waveform is just the beginning. The real value lies in understanding what it means.
Today, our goal is to analyze ERP components (e.g., P300, N400) in the context of cognitive tasks. We will learn to "read" the peaks and valleys of the ERP waveform, decode their language, and connect them to specific mental processes like attention, surprise, and understanding. For your work at Neuraease, this is the crucial step that transforms raw brainwave data into meaningful insights about a user's cognitive and emotional state.
1. From Waveform to Components: The Language of ERPs
The averaged ERP waveform is not a single, monolithic response. Instead, it's a sequence of positive and negative voltage deflections over time, known as ERP components. Each component is believed to reflect a specific stage of neural processing.
Scientists have a naming convention for these components:
- A letter indicates the polarity: P for a positive-going peak and N for a negative-going trough. (Note: by convention, negative is often plotted upwards).
- A number indicates either the component's order (e.g., P1 is the first positive peak) or its typical latency in milliseconds (e.g., N400 is a negative peak that occurs around 400 ms after the stimulus).
To quantify these components, we primarily look at two features:
- Amplitude: The size of the component's voltage deflection, measured in microvolts (). It often reflects the amount of neural resources dedicated to a processing stage.
- Latency: The time from stimulus onset to the component's peak, measured in milliseconds (ms). It reflects the speed or timing of that processing stage.
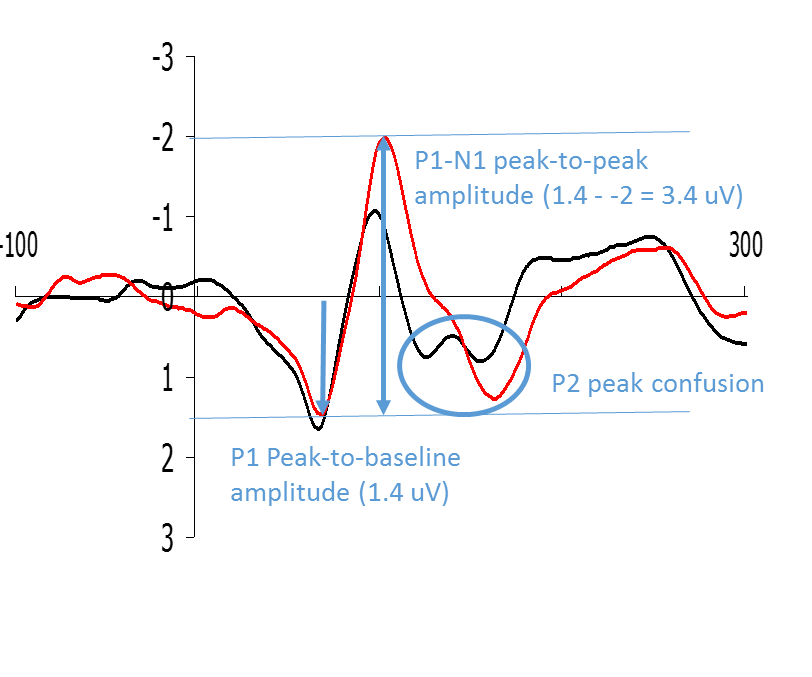
To see how these concepts are applied in practice, let's watch a brief segment of the video we touched upon last time.
An introduction to EEG analysis: event-related potentials
This video from the Cognitive Neuroscience Compendium provides an excellent overview of how ERP components are named and analyzed.
Please watch the segment from 15:43 to 18:40. Pay close attention to: The naming convention (N1, P2, N200). The different analysis approaches (magnitude, peak-to-peak). The example of how the N2 component differs between 'congruent' and 'incongruent' conditions in the Flanker task, showing a real-world application of component analysis.
As the video shows, the power of ERPs comes from comparing the amplitude and latency of components across different experimental conditions. A change in a component's characteristics tells us that the brain's processing was altered by our experimental manipulation.
2. The P300 Component: A Signal of Surprise and Attention
One of the most studied and robust ERP components is the P300, a large positive peak occurring roughly 300 to 600 ms after a stimulus.
The P300 is most famously elicited using an "oddball paradigm," where a participant is presented with a repetitive stream of standard stimuli, occasionally interrupted by an infrequent "oddball" or target stimulus. The brain's recognition of this rare and significant event is what generates the P300.
The following video provides an excellent, dedicated explanation of the P300.
P300 Event Related Potential Explained
This video from NeuroscIQ breaks down the P300, explaining how it's elicited, what it means, and its subcomponents.
Watch the segments from the beginning to 02:12 and from 06:47 to 08:37. Focus on understanding: The 'Oddball Paradigm' and how it elicits the P300. The two main subcomponents: P3a and P3b. The cognitive processes associated with the P300 (attention, cognitive processing).
To summarize and expand on the video's points, the P300 is not a single entity but has two main subcomponents with different functional roles and brain distributions:

- P3a (Novelty P3): Has a more frontal/central scalp distribution. It's elicited by novel, attention-grabbing, but task-irrelevant distractors. Think of it as the brain's "Ooh, what's that?" orienting response.
- P3b (Classic P3): Has a more parietal scalp distribution. It's elicited by task-relevant target stimuli that require a response or decision. It reflects context-updating in working memory—the brain's "Aha, that's the one I was looking for!" signal. Its amplitude is proportional to the amount of attention allocated to the stimulus.
Application for Neuraease: This distinction is directly relevant to your work.
- An alert on your wearable device that is designed to be consciously acknowledged by the user should elicit a strong P3b. A larger P3b amplitude would indicate the user allocated more attention to the alert.
- A random, unexpected sound from the user's environment might elicit a P3a, signaling that their attention was captured involuntarily.
By analyzing these components, you could objectively measure how effectively your system's notifications are capturing and directing a user's attention.
3. The N400 Component: A Signal of Semantic Meaning
Another classic component is the N400, a negative-going wave that peaks around 400 ms post-stimulus. It is a marker of semantic processing.
The N400 was famously discovered in experiments where participants read sentences that ended with an unexpected word, such as:
"I take my coffee with cream and socks."
The semantically incongruous word "socks" elicits a much larger N400 than an expected word like "sugar." The N400 amplitude reflects the brain's effort to integrate a stimulus into its current semantic context. A larger N400 indicates a "semantic surprise" or difficulty in making sense of something.
This doesn't just apply to language. It can be elicited by pictures, sounds, and even social cues that violate expectations. Most interestingly for you, it is also modulated by emotion.
The following resource is a research paper that investigates how emotion regulation affects ERPs. We'll focus on the part of its introduction that explains how N400 and P300 are influenced by emotion.
The Cognitive Consequences of Emotion Regulation: An ERP Investigation
This excerpt from the paper 'The Cognitive Consequences of Emotion Regulation' explains the theoretical link between emotion, cognitive resources, and the N400 and P300 components.
Please read the section titled 'Emotional Expectancies and Resource Allocation'. Focus on how the authors connect: N400 to emotional incongruity and affective expectations. P300 to the availability of cognitive resources, which can be depleted by negative emotional states.
As the paper discusses:
- N400 and Emotion: If you are in a negative state, you expect negative things. Presenting a neutral or positive stimulus might violate that affective expectation, leading to a larger N400.
- P300 and Emotion: Being in a negative emotional state, or actively trying to regulate your emotions, consumes cognitive resources. This leaves fewer resources available for other tasks, which would be reflected in a reduced P300 amplitude to subsequent stimuli.
4. Case Study: Connecting ERPs to Emotional State
Let's look at the results of that same study to see these principles in action. In the experiment, participants were shown unpleasant pictures and told to either increase, maintain, or decrease (suppress) their negative feelings. Immediately after, they were shown a word and their N400 and P300 responses were measured.
Here's what the researchers found (as described in the "N400" and "P300" subsections of the Results, and interpreted in the "ERP Findings" part of the Discussion in resource LINK):
- P300 Results: P300 amplitude was smallest when participants had just finished increasing their negative emotions. This supports the theory that actively amplifying a negative state consumed the most cognitive resources, leaving less attentional capacity to process the word that followed.
- N400 Results: N400 amplitude was smallest (least "semantic surprise") when participants had just finished decreasing their negative emotions. This suggests that after successfully calming down, their brain was in a more neutral state, making it easier to process subsequent words without affective conflict.
This study is a powerful proof-of-concept for your work at Neuraease. It empirically demonstrates that ERP components are sensitive, objective markers of the cognitive load (P300) and contextual processing (N400) that are directly impacted by a person's immediate emotional state and their efforts to regulate it.
Test your understanding!
Imagine you are developing a new feature for Neuraease that provides a "cognitive refresh" exercise after a stressful event. To test its effectiveness, you have users perform this exercise and then immediately complete a simple oddball task (detecting a rare target tone).
Based on the principles discussed today, what change would you predict in the P300b component elicited by the target tones after a successful cognitive refresh, compared to before? Why?
Show answer
You would predict an increase in P300b amplitude after the cognitive refresh exercise.
Reasoning: The P300b's amplitude is related to the allocation of attentional resources. The initial stressful event likely depleted these resources, resulting in a smaller P300b. A successful "cognitive refresh" exercise should, by definition, help restore those cognitive resources. With more attentional resources available, the brain can allocate more of them to processing the target tone in the oddball task, leading to a larger P300b amplitude.
Conclusion
Today, you've learned to interpret the language of ERPs. We've moved from simply seeing a waveform to understanding what its constituent parts—the components—can tell us about the mind.
Key Takeaways:
- ERP waveforms are analyzed by identifying named components (peaks and troughs).
- The key metrics are amplitude (reflecting resource allocation) and latency (reflecting processing speed).
- The P300 component is a marker of attention and context-updating, often elicited by rare or surprising stimuli. Its amplitude indicates how much attention was allocated.
- The N400 component is a marker of semantic integration. Its amplitude reflects the brain's effort to make sense of a stimulus in the current context.
- Crucially, both components are modulated by a person's emotional state, making them invaluable tools for objectively studying the cognitive effects of emotion and stress.
Preview of the Next Lesson:
We have spent a lot of time on the brain's electrical signals (EEG). In the next module, we will broaden our scope to include other vital physiological indicators. We will begin by exploring the somatic nervous system, learning to differentiate between surface EMG (sEMG) and intramuscular EMG recordings and their applications. This will give us a new tool for measuring muscle activity, which is another critical piece of the puzzle in understanding stress and motor responses.
Can't find a good explanation? Sign up and we'll make it for you
Sign up