Hello! Welcome to the next lesson in our journey to mastering B2B copywriting.
In our last session, we focused on the art of storytelling, learning how to structure a case study as a narrative of buyer transformation. We established that making the customer the hero and your solution the trusted guide is key to creating an emotional connection.
However, for a skeptical B2B audience, a great story isn't enough. It needs proof. Business decisions are defended with data. That's our focus today. Our learning outcome is to extract and present quantifiable results in a case study to build credibility. We'll cover how to find the hard numbers that make your story's happy ending undeniable and how to present them for maximum impact.
1. The Power of Proof: Why Numbers Build Credibility
In B2B, the buyer isn't just buying for themselves; they're making a decision on behalf of their company. They need to justify their choice to colleagues, managers, and the finance department. A compelling story gets their attention, but concrete data gives them the confidence—and the ammunition—to advocate for your solution.
Failing to include this data is a common mistake that renders many case studies ineffective.
How to Create Case Studies That Actually Drive B2B Growth
This article, 'How to Create Case Studies That Actually Drive B2B Growth,' clearly identifies the common pitfalls of case study writing. Let's look at what it says about the importance of data.
Please read the section 'Sidestepping the Common Traps.' Pay close attention to the third bullet point: 'No Hard Numbers.' This highlights why a story can feel 'flimsy' without the metrics to back it up.
Your goal is to bridge the gap between the emotional appeal of your narrative and the rational need for justification. Numbers are that bridge.
2. Extracting the Data: Asking for the Numbers
Getting credible numbers starts long before you write. It begins with selecting the right customer and asking the right questions.
When you interview a customer for a case study, your job is to be a journalist, digging for the specifics that bring the story to life.
9-Step Formula For Writing The PERFECT Case Study
In this clip from her '9-Step Formula For Writing The PERFECT Case Study,' Alex Cattoni explains why a live interview is so crucial for uncovering the details you need.
Watch from the beginning of her discussion on interviewing the client (02:23) until she moves on to transcribing the interview (04:04). Notice her emphasis on asking open-ended questions to pull out 'specific details' and 'specific results.'
So, how do you ask for those results? You need to be direct. Let's return to the article "How to Create Case Studies That Actually Drive B2B Growth" for a very specific, practical question you can use.
How to Create Case Studies That Actually Drive B2B Growth
This resource provides an excellent table of sample interview questions. One question in particular is designed specifically to extract the data we need.
Find the table titled 'Essential Case Study Interview Questions.' Locate the first question in the 'After' stage. This is the money question: 'Could you share 2-3 specific metrics that have improved and by how much?' This is the kind of direct question that gets you the quantifiable data you need.
By asking direct questions about metrics during a live conversation, you can uncover the core KPIs (Key Performance Indicators) that will form the backbone of your case study's credibility.
3. Presenting the Results: Making Data Persuasive
Once you have the numbers, how you present them is just as important as the numbers themselves. A busy executive won't dig through paragraphs of text to find the ROI. You must make your results scannable and immediately impactful.
The Before-and-After Table
One of the most effective ways to present data is a simple "Before/After" table. It clearly illustrates the transformation your customer experienced.
B2B Case Study Template (+ 10 Examples & 2025 Best Practices)
This B2B case study template from The Logonaut provides a clear, modern structure for presenting results. It's built for today's skimmers and busy buyers.
Scroll down to 'The 2025 Case Study Template.' Find the 'Results' section and look at the structure for the bullet points and, more importantly, the 'Before/After table.' Notice how it cleanly presents the Metric, Before, After, and Timeframe. This is a powerful, at-a-glance format.
Telling a Story with Data
Beyond tables, you can also use visuals to tell a story. This doesn't have to be complicated. The goal is to visually represent the change or conflict that your data reveals.
Telling Stories with Data in 3 Steps (Quick Study)
This short video from Harvard Business Review, 'Telling Stories with Data in 3 Steps,' introduces a powerful framework: Setup, Conflict, Resolution. It shows how to find a narrative within a data set and present it in a way that creates an emotional connection.
Watch the first three minutes of the video (00:08 - 02:57). Focus on how the presenter takes a complex chart and finds stories within it by identifying a 'setup' (the initial reality), a 'conflict' (a change to that reality), and a 'resolution' (the new reality).
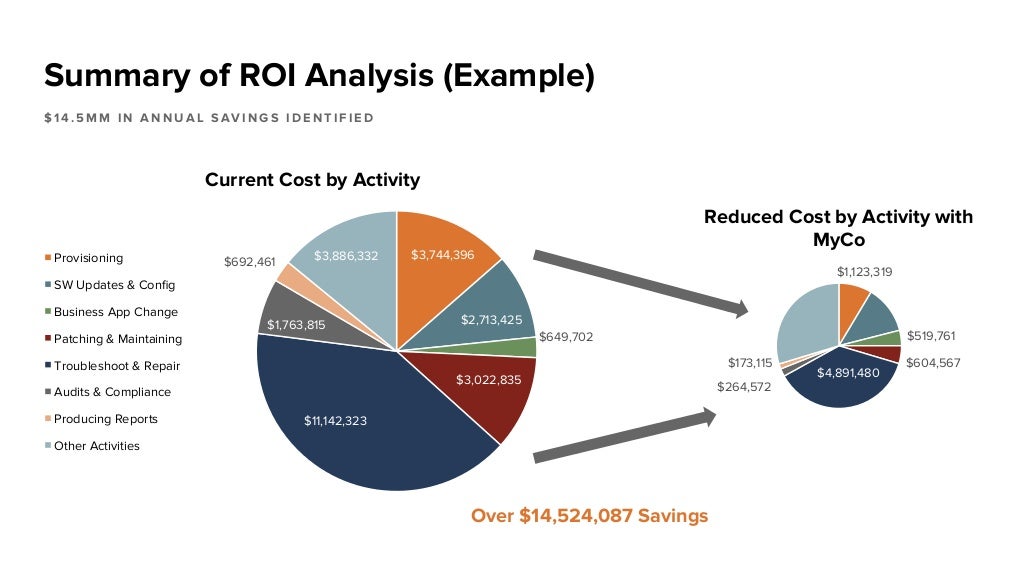
This "Setup, Conflict, Resolution" model is exactly what a Before-and-After table or chart accomplishes.
- Setup: The "Before" state (e.g., high costs, low efficiency).
- Conflict: The introduction of your solution.
- Resolution: The "After" state (e.g., reduced costs, higher efficiency).
Here is a great example of this principle in action, showing a clear before-and-after ROI analysis.
4. When the Numbers Are Fuzzy
What happens when a customer can't or won't share exact dollar amounts or percentages? This is a very common challenge. The key is to use defensible proxies and qualitative descriptions that still demonstrate value.
B2B Case Study Template (+ 10 Examples & 2025 Best Practices)
Let's look at the 'Common Questions' section of the Logonaut article, which gives excellent advice for this exact situation.
Read the answer to the first question: 'What if the customer won’t/can't share exact numbers?' Notice the practical suggestions: relative deltas (e.g., -18% average handle time), ranges (10-15%), or focusing on metrics like 'time-to-value'.
These proxies, combined with powerful quotes about operational improvements (e.g., "It freed up our senior engineers to focus on innovation"), can build a credible and compelling case even without specific revenue or ROI figures.
5. Your Turn: Presenting the Results
Let's return to our scenario with Innovate Design and SyncUp. In the last lesson, we wrote the narrative for their challenge. Now, let's say after your interview, you've extracted the following results:
- Before SyncUp: Project managers spent 5 hours/week chasing approvals.
- After SyncUp: Project managers spend 1 hour/week on approvals.
- Before SyncUp: Roughly 20% of projects had significant rework due to lost feedback.
- After SyncUp: This dropped to less than 5%.
- Before SyncUp: Onboarding a new client to a project took 3-4 days of setup and training.
- After SyncUp: Onboarding now takes about 2 hours.
- The entire implementation and rollout took 4 weeks.
Your Task (15-20 minutes):
- Draft a Headline: Based on the advice from the resources, write an outcome-focused headline for this case study. Pick the single most powerful result and put it front and center.
- Write the "Results" Section: Create a bulleted list of 3-4 key results. Don't just list the numbers; frame them in terms of business value (e.g., "Freed up project managers by...").
- Create a Before/After Table: Using the template from the Logonaut article, create a table that presents at least three of these metrics.
Debrief and Model Answer
Great work. The objective was to translate raw data points into clear, persuasive, and scannable proof points.
Here’s one way you could have approached it:
1. Headline:
How Innovate Design Cut Project Admin by 80% in 4 Weeks with SyncUp
(This headline is strong because it leads with a specific, impressive percentage, includes a short timeframe, and names the customer and product.)
2. "Results" Section:
The adoption of SyncUp transformed Innovate Design’s workflow, leading to immediate and measurable improvements in efficiency and client service.
- Reduced administrative overhead by 80%, freeing up project managers to focus on high-value strategic work instead of chasing approvals.
- Decreased costly rework by over 75% by centralizing all client feedback and eliminating communication gaps.
- Accelerated client onboarding by 90%, moving from a multi-day setup to a process that takes just a couple of hours.
- Achieved full team adoption and positive ROI within the first month of implementation.
3. Before/After Table:
| Metric | Before SyncUp | After SyncUp | Timeframe |
|---|---|---|---|
| PM Time on Approvals | 5 hours / week | 1 hour / week | 4 weeks |
| Projects with Rework | ~20% | <5% | 4 weeks |
| Client Onboarding Time | 3-4 days | 2 hours | 4 weeks |
Notice how each element is designed for a busy reader. The headline gives the main takeaway, the bullets add context and benefits, and the table provides the undeniable, side-by-side proof.
Conclusion
You've now added the most critical element of B2B persuasion to your toolkit: proof. A story without data is just an opinion. A story with data is a business case.
Key Takeaways:
- Numbers Build Credibility: B2B buyers need rational proof to justify their decisions.
- Extract with Precision: Use direct interview questions to get specific, quantifiable metrics from your customers.
- Present for Impact: Use headlines, bolded text, bullet points, and especially Before/After tables to make your results impossible to ignore.
- When Numbers are Fuzzy, Use Proxies: If you can't get exact figures, use relative changes, ranges, or qualitative descriptions of operational improvements to demonstrate value.
Preview of the Next Lesson:
A powerful case study is a valuable asset, but its life doesn't end on your website's "customers" page. In our next lesson, we'll learn how to repurpose a single case study into multiple formats (like testimonial quotes, email snippets, and social media posts) to maximize its impact across your marketing channels.