
Good to see the dump become useful evidence rather than just a crash artifact. In the previous lesson, you captured and validated a full user-mode dump, confirmed the exception context with .ecxr, and recorded a stable symbolic crash signature. Now the task is to explain what the faulting thread was doing in terms that match the C/C++ source: which values were inputs, which are temporaries, where the active stack frame begins, and which conclusions are actually justified by the assembly.
At the end of this lesson, you should be able to take an x64 crash context and produce a defensible mapping from faulting instruction, registers, stack artifacts, and ABI conventions back to the relevant source-level operation. This is the bridge between “the program crashed at an address” and “this specific source expression dereferenced this specific object field using this index.”
1. Begin with the exception-time context
A dump contains many possible thread contexts. The one you want initially is the context Windows recorded for the exception—not necessarily whichever thread WinDbg currently selected after opening the file.
Run this short sequence first:
.symfix C:\Symbols
.reload /f
.lastevent
.exr -1
.ecxr
r
ln @rip
k
The critical command is .ecxr. It changes WinDbg’s active register context to the context associated with the current exception. Thus, @rip, @rsp, @rcx, and the stack trace thereafter refer to the faulting thread at the exception point.
.ecxr (Display Exception Context Record) - Windows drivers
Read Microsoft’s documentation for .ecxr to establish precisely what context WinDbg selects and how long that selection remains active.
In the “Remarks” section, read the context switch. Focus on the distinction between locating a saved exception context and making that context active for later register and stack commands.
A typical r output includes general-purpose registers, RIP, RSP, and EFLAGS:
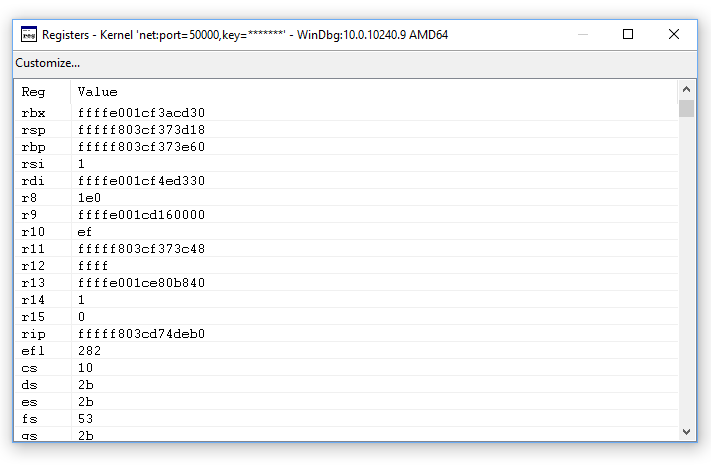
Treat the first pass as an evidence-preservation step. Record:
- Exception code and parameters from
.exr -1. - Faulting instruction address from
@rip. - Symbolic location from
ln @rip. - Full register state from
r. - Initial stack trace from
k.
Do not begin by assigning source-level meanings to every register. At a fault site, a register might hold an original function argument, a local variable, an address loaded from an object field, a loop counter, a compiler temporary, or an unrelated value left in a volatile register. The adjacent machine instructions determine which interpretation is warranted.
For example, if the faulting instruction is:
movzx eax, byte ptr [rax+rdx]
then the immediate facts are:
RAXis being used as an address base.RDXis being used as an index or displacement contribution.- The attempted memory address is .
- The instruction reads one byte and zero-extends it into
EAX.
Those are facts about the fault. Whether RAX is a buffer pointer, an object field, or a return value must be established from earlier instructions and the function’s source-level structure.
Use WinDbg to inspect the instruction in context:
u @rip L12
ub @rip L12
The forward disassembly shows what the faulting instruction does next; the backward disassembly is often more valuable because it shows where its operands came from.
A useful working rule is:
Interpret registers from the instructions that consume and define them, then use the ABI and source signature to test that interpretation.
2. Use the Windows x64 ABI as a hypothesis—not a shortcut
The Microsoft x64 calling convention gives a reliable picture of values at a normal function entry. A crash commonly occurs after the function’s prologue, branches, and temporary calculations, so the ABI is your starting hypothesis rather than automatic proof of what every register means at RIP.
Read Microsoft’s x64 ABI reference. It is the primary reference for recovering C/C++ argument locations and identifying which register values may have been overwritten by intervening calls.
Start with “Calling convention defaults.” Read the ABI overview to understand the four argument slots and caller-provided shadow space. Then read “Parameter passing,” especially its table and mixed-type examples. Follow argument positions; pay attention to the fact that position, not simply type count, selects an argument slot. Finally, in “Caller/callee saved registers,” read the volatile-register rule. Apply it conservatively when deciding whether a crash-time value can still be called an original argument.
For ordinary non-variadic native calls, the first four argument positions are assigned as follows:
| Source argument position | Integer, pointer, reference, small aggregate | float or double |
|---|---|---|
| 1 | RCX | XMM0 |
| 2 | RDX | XMM1 |
| 3 | R8 | XMM2 |
| 4 | R9 | XMM3 |
| 5 and later | Stack | Stack |
The crucial detail is that argument positions are not compacted by type. Consider:
void Decode(
    uint32_t recordType,
    double scale,
    const uint8_t* bytes,
    float threshold,
    size_t count);
At entry, the mapping is:
| Source expression | Entry location |
|---|---|
recordType | low 32 bits of RCX |
scale | XMM1 |
bytes | R8 |
threshold | XMM3 |
count | stack |
The double uses XMM1, not XMM0, because it occupies the second argument position. The first slot remains associated with RCX, even though it contains an integer rather than a floating-point value.
Modern x64 Assembly 12: C Calling Convention (Passing Parameters)
Watch “Modern x64 Assembly 12: C Calling Convention (Passing Parameters)” by Creel for a compact visual demonstration of the positional rule in mixed integer and floating-point calls.
Watch mixed arguments. Track each parameter by its ordinal position first, then choose its general-purpose or XMM register according to type; this avoids the common mistake of assigning the first floating-point argument encountered to XMM0.
Shadow space and stack-passed arguments
Before making a call, the caller reserves 32 bytes of shadow space (also called home space) for the callee’s four register-argument slots. The callee may store register values there if it needs stable memory copies, but it is not required to do so. Reserved shadow space is therefore an ABI artifact, not guaranteed evidence that a particular argument value remains in memory.
At the first instruction of a normally entered callee, the stack has this conceptual form:
Address relative to entry RSP | Typical meaning |
|---|---|
[RSP] | Return address into the caller |
[RSP+0x08] through [RSP+0x27] | 32-byte shadow space |
[RSP+0x28] | Fifth argument |
[RSP+0x30] onward | Sixth and later arguments |
This is an entry-state map. Once the callee executes a prologue such as push rbx or sub rsp, ..., current RSP no longer equals entry RSP. Do not mechanically read [current RSP+0x28] at a later crash and label it the fifth argument. First inspect the prologue and any frame setup.
A non-static C++ member function follows the same rule: its implicit this pointer is its first argument and normally arrives in RCX at entry.
class Parser {
public:
    uint8_t ReadByte(size_t index, uint32_t mode);
};
At entry to Parser::ReadByte:
RCXisthis;RDXisindex;R8Dismode.
For return values, scalar integers and pointers normally use RAX; scalar floating-point values use XMM0. At an arbitrary faulting instruction, however, RAX is often just a scratch register. It should be described as “the value used in this instruction” unless you are at a return sequence or immediately after a call whose result you can identify.
3. Separate stable ABI artifacts from compiler-generated state
At an exception point, classify register observations by confidence.
| Observation | Typical confidence | Why |
|---|---|---|
RIP identifies the faulting instruction | High | It is part of the exception context. |
| Registers named directly by the faulting instruction | High | The operands are explicit in disassembly. |
| A register equals its ABI argument at function entry | Medium | Confirm that intervening instructions did not overwrite it. |
| A nonvolatile register holds a useful value | Medium | It survives calls, but may still be a local or cached pointer. |
| A volatile register contains an original input | Low by default | Calls and compiler temporaries may overwrite it. |
| A qword in shadow space is an argument copy | Low by default | The callee may never have written it. |
A dv local-variable value reflects current optimized code | Variable | Debug information can describe a local as unavailable, moved, or optimized out. |
The volatile general-purpose registers are RAX, RCX, RDX, R8, R9, R10, and R11. A called function may overwrite them. The commonly relevant nonvolatile general-purpose registers are RBX, RBP, RSI, RDI, and R12 through R15; a function that uses one must preserve the caller’s original value.
That rule is important during crash reconstruction. Suppose a loop keeps a source pointer in RSI across a helper call. The compiler may choose RSI precisely because its value must survive that call. This supports an interpretation of RSI as a persistent local pointer—but it still does not establish whether that pointer began as RCX, an object field, or the return of an allocator. Follow its definitions in disassembly.
EFLAGS deserves similar restraint. A conditional branch near the fault may have depended on flags produced by a nearby cmp or test, but flags are overwritten frequently. Use them only with the instructions immediately surrounding the branch; do not infer a high-level source predicate solely from the efl value in the register display.
4. Work from a source expression to the faulting operands
Consider this deliberately unsafe laboratory function:
struct Packet {
    const uint8_t* bytes;
    size_t length;
};

__declspec(noinline)
uint8_t ReadField(
    const Packet* packet,
    size_t index,
    uint32_t kind,
    uint32_t flags,
    uint64_t requestId)
{
    if (kind == 7 && (flags & 1) != 0) {
        return packet->bytes[index];   // intended crash location
    }
    return 0;
}
At function entry, the ABI predicts:
| Parameter | Entry location |
|---|---|
packet | RCX |
index | RDX |
kind | low 32 bits of R8 |
flags | low 32 bits of R9 |
requestId | [entry RSP+0x28] |
A plausible optimized instruction sequence for the highlighted expression is:
mov     rax, qword ptr [rcx]       ; RAX = packet->bytes
movzx   eax, byte ptr [rax+rdx]    ; load packet->bytes[index]
If the second instruction faults, map it in this order:
-
Read the actual memory operand.
The faulting address is , and the operation is a byte read. -
Trace the base register.
The precedingmov rax, [rcx]says thatRAXwas loaded from offset zero of the address currently inRCX. -
Compare that with the C++ layout.
Packet::bytesis the first field, so offset zero is consistent withRCXbeingpacketandRAXbeingpacket->bytes. -
Trace the index register.
IfRDXhas not been redefined between entry and the fault, it remains consistent with the source-levelindexparameter. -
State the conclusion with evidence.
A strong reconstruction is: “The process faulted while reading one byte atpacket->bytes[index]; the instruction loadedpacket->bytesfrom[RCX]and usedRDXas its index.”
A weaker, unjustified reconstruction would be: “RCXmust be a validPacket*because the ABI says first arguments useRCX.” The ABI alone cannot establish validity.
In the actual crash dump, use this sequence:
.ecxr
ln @rip
uf @rip
ub @rip L12
r
? @rax + @rdx
dps @rsp L20
.frame /r 0
dv /t
Interpret the commands as a chain:
ln @ripidentifies the nearest source symbol or module-relative location.uf @ripgives the containing function, including its prologue and epilogue.ub @rip L12identifies immediate dataflow into the faulting operands.? @rax + @rdxcalculates the attempted effective address for the example instruction.dps @rsp L20displays the current stack as pointers where possible..frame /r 0makes explicit that you are examining the faulting frame.dv /tasks WinDbg to show source-level locals and types when matching debug information can describe them.
If an operand cannot be read because its effective address is invalid, that is expected in an access-violation investigation. The failed read itself is part of the evidence. You are not trying to make the address valid; you are determining why the program attempted to use it.
Why source lines are useful but insufficient
With matching PDBs and a Debug build, WinDbg may point directly to the source line. That is excellent orientation, but the assembly remains authoritative about the machine operation that faulted.
For optimized builds:
- a source variable may not have a single fixed memory location;
- multiple source expressions can be folded into one instruction sequence;
- an argument register can be reused after its original value is no longer needed;
- inlining can make a source-level function appear in a logical call stack without a physical call instruction.
Therefore, construct claims in layers:
- Machine fact:
movzx eax, byte ptr [rax+rdx]attempted a byte read. - Dataflow fact:
RAXwas loaded from[RCX]immediately beforehand. - Source correlation: the layout and source line identify
[RCX]as thebytesfield of aPacket. - Root-cause hypothesis: an invalid
packet, invalidbytesfield, or invalidindexled to the bad access.
The next crash-triage module will make that last distinction systematically. For now, preserve the distinction between direct observation and hypothesis.
5. Read the stack as a frame, not as an array of “addresses”
The stack view is evidence about control flow and local state. It is not automatically a clean list of return addresses.
Start with:
k
kv
dps @rsp L30
k provides a compact stack trace. kv adds more frame detail, including arguments where the debugger can recover them. dps is a raw stack-oriented view that attempts to symbolize values that resemble code pointers.
At a fault inside a non-leaf function, the current stack region may contain:
- local variables and compiler spill slots;
- saved nonvolatile registers;
- stack security-cookie material in suitable builds;
- temporary call-argument areas;
- the caller’s return address;
- the caller’s shadow space and stack-passed arguments;
- earlier stack frames.
The function prologue determines the precise layout. For example:
push    rbx
sub     rsp, 40h
mov     rbx, rcx
means RBX was saved and then used to retain the original value of RCX. At the crash site, RBX may be stronger evidence for the original packet argument than RCX, which might have been reused.
Conversely, if you see:
mov     rcx, rax
call    SomeHelper
then RCX immediately before the call represents SomeHelper’s first argument, not necessarily the enclosing function’s first argument. This is a common source of misleading crash notes.
For a raw stack value that appears to be a code address, validate it before calling it a return address:
ln poi(@rsp)
This only tests the qword at the current stack pointer. If the function has allocated locals or saved registers, that qword may not be the caller return address. Use the prologue, the unwound k/kv output, and nearby instructions together.
A controlled entry-state validation
When a crash is reproducible, validate the ABI separately during a live debug run. Set a breakpoint at the first instruction of a selected non-inlined function:
bp NativeLabPlain!ReadField
g
r rcx rdx r8 r9 rsp
dq @rsp L6
At this entry breakpoint, before the prologue executes:
[RSP]is the return address;[RSP+0x08]through[RSP+0x27]are shadow-space slots;[RSP+0x28]is the fifth argument.
This controlled observation gives you a known-good entry map. You can then continue execution, reproduce the crash, and compare it with the exception-time context. The difference between the two views shows exactly which registers the compiler repurposed and which values it preserved in stack slots or nonvolatile registers.
6. Produce a concise register-to-source reconstruction
For each retained crash, add a short reconstruction block to the lab record. Keep facts and hypotheses separate.
Exception-time context:
  Thread:
  Exception code:
  RIP / symbol:
  Faulting instruction:

Instruction-level evidence:
  Memory operand:
  Access type:
  Effective-address calculation:
  Registers consumed by the instruction:
  Immediate register definitions before the fault:

Source correlation:
  Source file and line:
  Containing C/C++ function:
  Relevant C++ expression:
  Object/field offsets confirmed by disassembly:

Calling-convention evidence:
  Function-entry signature:
  Entry-register expectations:
  Which argument mappings remain proven at the crash:
  Which mappings are only inferred:

Stack evidence:
  Current RSP:
  Unwound caller:
  Saved nonvolatile registers or local spills:
  Stack-passed arguments, if established:

Conclusion:
  Directly observed:
  Most likely source-level interpretation:
  Unresolved alternatives:
A good conclusion is narrow enough to survive later evidence. For the ReadField example:
Directly observed: a byte read at faulted.
RAXwas loaded from[RCX]immediately before the read.
Source correlation: this matchespacket->bytes[index]inReadField.
Remaining uncertainty: current evidence does not yet distinguish a corruptPacket*, corruptbytesfield, or invalidindex.
That level of precision is far more useful for exploitability analysis than a broad statement such as “controlled crash” or “bad pointer.”
Key takeaways
A reliable x64 crash reconstruction follows evidence outward from the fault:
- Use
.ecxrbefore interpretingRIP, registers, or the stack; it selects the exception-time context. - Decode the faulting instruction first. Its explicit operands establish what the CPU attempted to access.
- Apply the Windows x64 ABI to reconstruct function-entry argument locations:
RCX,RDX,R8,R9, then stack arguments after shadow space. - Do not assume those entry mappings still hold at the crash. Trace register definitions and respect volatile-register reuse.
- Treat shadow space as reserved ABI storage, not automatically initialized argument copies.
- Read
RSPand stack values in light of the current function’s prologue, saved registers, and unwind-based stack trace. - Record direct machine facts separately from source-level interpretations and unresolved alternatives.
Next, you will consolidate these facts into a durable lab record: fixed target identity, mitigation settings, symbols, trigger material, expected crash signature, and the register-to-source reconstruction needed to reproduce later analysis.
Can't find a good explanation? Sign up and we'll make it for you
Sign up