
Welcome back. The previous lesson established what your two x64 target binaries claim statically: PE header flags, Load Configuration metadata, and manifest settings. Now we turn a chosen build into a dynamic debugging artifact: a crash dump that preserves the process state at the terminal exception.
For this lab, the target is only an intentionally vulnerable application in your isolated VM. The goal is not merely to obtain a .dmp file, but to create a capture that another lab session can identify, load, and compare against the same target build and trigger. By the end, you will have a full user-mode crash dump, a minimal validation transcript, and a reproducibility record.
1. Decide what the dump must preserve
A crash dump is a snapshot of a process at a particular moment. It contains varying amounts of process memory and metadata depending on how it was collected. For later work on heap state, corrupted objects, and attacker-controlled buffers, the default Windows “small dump” is often too constrained: it may preserve a useful stack but omit the allocation or buffer you need to inspect.
For this course’s baseline, capture a full user-mode dump using ProcDump’s -ma option:
- It includes accessible image, mapped, and private memory, plus process, thread, module, handle, and address-space metadata.
- It can be large. Treat its size as expected behavior, not evidence that something went wrong.
- It may contain sensitive process data. Keep it inside the isolated lab VM, restrict access to the dump directory, and do not upload or share it casually.
The event you want is an unhandled exception—the terminal exception that the process does not recover from. ProcDump uses -e for this. Do not begin with -e 1, which captures first-chance exceptions too. Desktop applications, runtime libraries, and even normal Windows components may use handled exceptions internally; first-chance capture tends to create noise and makes it harder to establish one stable crash artifact.
ProcDump - Sysinternals | Microsoft Learn
Read Microsoft’s ProcDump reference to establish the dump-size and exception-trigger options before using them in the lab.
In the Dump Types table, read the Full-dump entry and contrast it briefly with Mini and MiniPlus. Then, in the Conditions table, read the exception trigger, paying particular attention to the distinction between -e and -e 1. Finally, under Examples, find the examples titled “Write a Full dump for a 2nd chance exception” and “Launch a process called 'notepad' (and monitor it for exceptions)” to see the command patterns used below.
A useful mental model is:
| Collection choice | What it means for this lab |
|---|---|
-ma | Preserve the complete user-mode memory picture; use this as the baseline. |
-e | Wait for the application’s unhandled, terminating exception. |
-n 1 | Stop after one dump, preventing an accidental collection loop. |
-x | Have ProcDump launch the exact target rather than racing to attach after it starts. |
-accepteula | Accept the Sysinternals license noninteractively on the isolated VM. |
2. Establish a controlled capture directory and target identity
Use one fresh directory per capture attempt. This prevents stale dumps from being mistaken for the current run and makes repeatability comparisons much cleaner.
In PowerShell, adjust the paths to match your previous build output. The example uses NativeLabPlain.exe; if your known crash is in the hardened build or another intentionally vulnerable target, substitute that exact executable.
$runId = 'Run001'
$dumpDir = "C:\Lab\Dumps\$runId"
$target = 'C:\Lab\Targets\NativeLab\x64\Debug\NativeLabPlain.exe'
$procDump = 'C:\Tools\Sysinternals\procdump64.exe'

New-Item -ItemType Directory -Path $dumpDir -Force | Out-Null

Get-Item $target |
    Select-Object FullName, Length, LastWriteTime

Get-FileHash $target -Algorithm SHA256
Before continuing, confirm all of the following:
$targetis the intended native x64 executable from the prior build.- The SHA-256 value is copied into your lab record.
$procDumppoints to the ProcDump binary actually installed in the VM. If your installation providesprocdump.exerather thanprocdump64.exe, use that filename instead.- The target is not already running.
- WinDbg is not attached to the target. ProcDump should be the only crash collector for this capture.
The hash matters because target names are not identities. Rebuilding NativeLabPlain.exe under the same name can change code layout, PDB matching, and the exact crash behavior even if the test input appears unchanged.
3. Launch and monitor the laboratory target with ProcDump
ProcDump’s -x mode launches the target and starts monitoring it immediately. This avoids a common capture failure: manually starting a short-lived application and only attaching the collector after the exception already occurred.
If your lab crash is triggered through the application UI, set $targetArgs to an empty array. ProcDump will launch the program; then reproduce the documented UI sequence. If the application accepts a known test file or command-line trigger, place its actual arguments in the array.
# Example only: replace these with your target's documented trigger arguments,
# or leave the array empty for a UI-driven trigger.
$targetArgs = @()

& $procDump `
    -accepteula `
    -ma `
    -e `
    -n 1 `
    -dc "NativeLabPlain $runId" `
    -x $dumpDir `
    $target `
    @targetArgs
What happens next depends on the target:
- For a command-line crash trigger, the process may fault immediately.
- For a desktop target, ProcDump remains active while the application is open. Perform the exact trigger steps you recorded for the vulnerability.
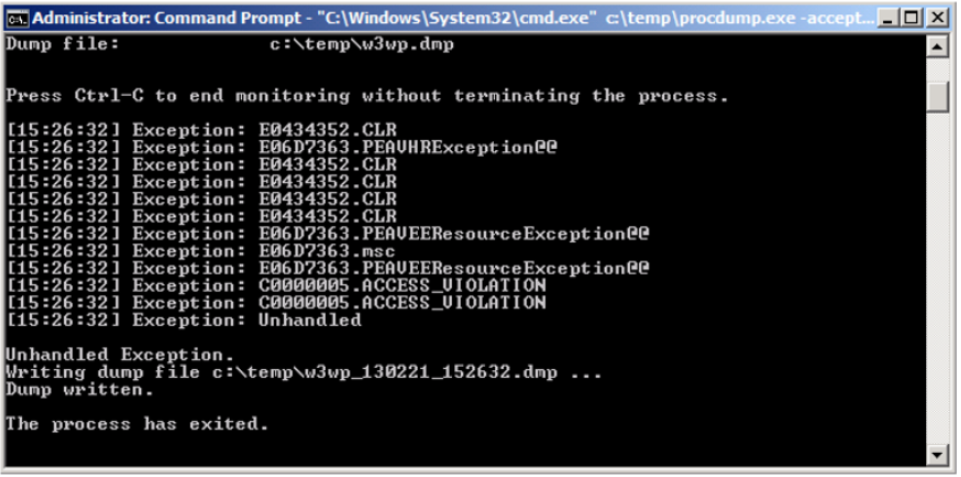
- When the unhandled exception occurs, ProcDump should report that it is writing a dump and then confirm that the dump was written.
The console may show exception notifications before the final capture. The critical outcome is the terminal message that a dump was successfully written—not merely the appearance of an exception line.
For this baseline, avoid adding clone mode (-r), first-chance mode (-e 1), or multiple dump sizes. Those options are useful in other debugging circumstances, but they introduce variables that do not help establish your first reproducible crash sample.
4. Verify the dump as an artifact, not just a file
After ProcDump exits, locate the newly created dump and record its basic properties.
$dump = Get-ChildItem -Path $dumpDir -Filter '*.dmp' |
    Sort-Object LastWriteTime -Descending |
    Select-Object -First 1

$dump |
    Select-Object FullName, Length, CreationTime, LastWriteTime

Get-FileHash $dump.FullName -Algorithm SHA256
A successful capture has three immediate indicators:
- ProcDump printed a successful dump-write message.
- A nonempty
.dmpexists in the directory created for this run. - The dump opens in WinDbg without a file-format error.
Open the dump in the WinDbg installation configured earlier. You can use File → Open dump file, then run this narrow validation sequence:
.symfix C:\Symbols
.reload /f
.lastevent
.exr -1
.ecxr
r
ln @rip
k
Do not try to fully reconstruct the bug yet; that is the purpose of the next lesson. At this stage, you are checking that the dump can answer four basic questions:
| WinDbg command | What to record now |
|---|---|
.lastevent | The exception type and the relevant faulting thread. |
.exr -1 | The exception code and exception parameters. |
.ecxr | Whether WinDbg can restore the exception-time register context. |
ln @rip | The faulting symbolic location or nearest module-relative location. |
k | Whether the stack contains a plausible path through the laboratory target. |
Do not compare the absolute value of RIP across launches. ASLR means the image base can legitimately differ. Instead, compare a semantic crash signature:
- exception code;
- operation category, if available from exception parameters;
- faulting module and symbol or module-relative offset;
- trigger identity; and
- target SHA-256.
For example, two launches with different absolute addresses can still be the same crash if each is an access violation in NativeLabPlain!ParseRecord+0x... under the same binary hash and input hash.
Sysinternals: ProcDump deep dive (demo) | Command line, CPU, crash dump, Windows | Microsoft
Watch the Microsoft Windows At Work demonstration of validating a captured crash dump in WinDbg. It reinforces the exact small command sequence you will use for baseline verification.
Watch the initial triage workflow. Focus on why .lastevent and .exr -1 describe the exception, while .ecxr changes the debugger back to the exception-time context before inspecting registers and stack state. The managed-code discussion later in the clip is not needed for this native x64 lab.
5. Make the capture reproducible
A dump is reproducible when it reflects a controlled target, controlled trigger, and stable crash signature—not when its bytes are identical to an earlier dump. Heap placement, randomized image bases, thread identifiers, timestamps, and unrelated allocator activity can all differ legitimately between runs.
Create a short capture record beside the dump. The following template is deliberately concise enough to maintain for every crash you keep:
Capture ID: Run001
Date and time:
VM snapshot or VM state:
Windows edition and build:

Target:
  Path:
  SHA256:
  File size:
  PDB available locally: Yes / No
  Static profile: Plain / Hardened / Other

Trigger:
  Input filename:
  Input SHA256:
  Command-line arguments:
  UI steps, if applicable:
  Expected terminal behavior:

Collector:
  ProcDump version:
  Exact ProcDump command:
  Dump mode: -ma
  Exception mode: -e
  Dump directory:

Output:
  Dump filename:
  Dump SHA256:
  Dump size:
  ProcDump reported “Dump written”: Yes / No

Initial WinDbg signature:
  .lastevent:
  .exr -1 exception code:
  Faulting thread:
  ln @rip:
  Stack observation:
Run the same procedure at least three times from clean process launches, using separate directories such as Run001, Run002, and Run003. Preserve the first successful dump from each run initially. Then compare the records, not raw dump binaries.
A reasonable baseline success criterion is:
The same fixed target and trigger produce an unhandled exception with the same exception code and the same faulting target function or module-relative location in three clean launches.
If one attempt differs, do not discard it automatically. Label it as a divergent run and retain its record. A differing exception code, changed target hash, or different faulting function can indicate a real reliability problem, a stale build, an input mismatch, or a distinct bug—not merely ordinary ASLR.
6. Common capture failures
ProcDump exits but creates no dump
Check these in order:
- Confirm the target actually reached an unhandled exception. An application that catches its own exception or performs recovery may not satisfy
-e. - Confirm the target path was correct and that ProcDump launched the intended executable.
- Confirm the dump directory exists, is writable, and has enough free disk space for a full dump.
- Check that the target was not already being debugged by WinDbg or another debugger.
- Use a new output directory before retrying, so an old dump cannot create ambiguity.
You received many dumps
This usually means first-chance exception capture was enabled accidentally, or the collector was configured to take multiple dumps. For the baseline command, retain -e and -n 1; do not add the 1 after -e.
The dump is too large
That is expected for -ma. Keep the full dump as the canonical capture because later modules will need heap and private-memory evidence. If storage becomes a genuine lab constraint, ProcDump’s MiniPlus mode (-mp) is a possible later tradeoff, but it is not a substitute for establishing one known-good full-dump baseline.
WinDbg opens the dump but lacks your source or symbols
First verify that the dump came from the target hash recorded in the lab record. Then verify that the matching PDB from that exact build remains available through the symbol and executable paths configured earlier. Do not “fix” a symbol mismatch by pointing WinDbg at a PDB from a newer rebuild.
You need automatic collection for repeated manual launches
Windows Error Reporting LocalDumps can configure per-application automatic collection after a crash. It is useful when an application is normally launched by a shell integration or another component rather than directly by ProcDump. For this course, keep ProcDump as the primary baseline collector because its launch command, dump type, and trigger condition are explicit in the record. Avoid enabling broad machine-wide crash collection or combining multiple collectors for the same run; that makes the provenance of each dump less clear.
Key takeaways
You now have a controlled method for producing a useful native user-mode crash artifact:
- Use ProcDump with
-ma -e -n 1to capture one full dump at the target’s unhandled exception. - Use
-xto launch the exact laboratory executable under monitoring, eliminating attach-time races. - Store every attempt in a fresh directory and identify the executable, input, and dump by hash.
- Validate the dump in WinDbg with
.lastevent,.exr -1,.ecxr,ln @rip, andk. - Compare crash signatures by exception and symbolic or module-relative location—not by absolute randomized addresses or byte-for-byte dump equality.
Next, you will use this dump to map x64 registers, stack state, and calling-convention artifacts back to the relevant C/C++ code at the fault site.
Can't find a good explanation? Sign up and we'll make it for you
Sign up