
Good debugging notes become increasingly valuable as a lab grows: they prevent accidental comparisons between different binaries, inputs, and mitigation states. In the previous lesson, you reconstructed a crash from the exception context outward—faulting instruction, register dataflow, ABI artifacts, and source correlation. This lesson turns that analysis into a lab record: a compact, evidence-backed specification of one reproducible target and one expected failure.
The aim is not to write a narrative postmortem. It is to create a record that lets you—or a later exploit-development session—answer five questions without guessing:
- Exactly which executable build crashed?
- Which mitigations were compiled, linked, and active at runtime?
- Which symbols and source paths made the analysis trustworthy?
- Which input and launch conditions triggered it?
- What stable crash signature should a correct reproduction produce?
1. Treat a crash as an experiment with a fixed configuration
A crash is only comparable to another crash if the relevant variables are controlled. For this course, a useful unit of work is:
This is more stringent than recording “NativeLabPlain.exe crashed with my malformed file.” The same filename can refer to a rebuilt executable; the same source can compile differently under changed optimization or linker flags; and the same malformed file can reach different behavior after a parser change.
A lab record should therefore distinguish facts observed from the artifact from settings claimed by the build configuration:
| Category | Strong evidence | Why it matters |
|---|---|---|
| Target identity | File path, SHA-256, PE machine type, file size, build timestamp | Distinguishes a precise executable from another build with the same name. |
| Build intent | Exact compiler and linker command lines, project settings, build configuration | Explains what the build was supposed to contain. |
| Binary properties | dumpbin / PE inspection output, loaded-image information | Checks what was actually emitted into the PE image. |
| Runtime policy | Captured process-mitigation output from the launched process | Some policies can be imposed or altered outside the image itself. |
| Symbol provenance | PDB path, load status, signature/age where available, source path | Prevents source lines and function names from being treated as trustworthy when they are not. |
| Trigger | Input hash, delivery method, command line or UI sequence | Makes the crash reproducible. |
| Signature | Exception, module-relative fault location, instruction, normalized stack | Allows equivalent failures to be recognized despite ASLR. |
The principle is simple: do not replace evidence with a label. For example, “CFG enabled” is incomplete unless your record says whether that conclusion came from linker settings, PE load-configuration metadata, runtime process policy, or all three.
2. Capture target identity before interpreting the crash
Start each record with a target identity block. A cryptographic hash is the anchor; timestamps and filenames are useful supporting metadata but are not unique identifiers.
For a laboratory target, collect this before opening the dump:
$target = "D:\Lab\NativeLab\bin\NativeLabPlain.exe"

Get-Item $target |
    Select-Object FullName, Length, LastWriteTimeUtc

Get-FileHash $target -Algorithm SHA256

& dumpbin /headers /loadconfig $target
Also preserve the build’s:
- Git commit or source archive identifier, if your lab uses one;
- configuration and architecture, such as
Release|x64; - compiler and linker versions;
- full compiler/linker command lines, or an archived build log;
- exact VM snapshot name and OS build;
- any target-side configuration file that changes parsing or allocation behavior.
A SHA-256 has a specific role: it identifies the bytes you analyzed. It does not prove that the running process actually mapped those same bytes. That is why the dump-side symbol and module checks later in this lesson remain necessary.
For a native x64 target, record the architecture explicitly. An x86-oriented observation—such as SafeSEH—is not meaningful for an x64 image and should be recorded as not applicable, not as “disabled.”
3. Record mitigation state in layers
Mitigations have different origins. The compiler may emit instrumentation; the linker may add PE metadata; Windows may apply process policy at launch; and hardware-dependent facilities may be unavailable or inactive. A useful record preserves those distinctions rather than collapsing them into one yes/no column.
Build reliable and secure C++ programs | Microsoft Learn
Read Microsoft Learn’s mitigation and debug-provenance guidance to anchor the fields you will preserve in the lab record. Focus on the difference between compiler/linker opt-ins and the build artifacts—especially PDBs—needed to investigate a specific build later.
In the section beginning “Mark binaries as compatible with OS runtime security mitigations,” read the mitigation options, noting /GS, /DYNAMICBASE, /HIGHENTROPYVA, /guard:cf, /CETCOMPAT, and /guard:ehcont. Then continue through the data-execution-prevention bullet, ending with the DEP note. In the later section, “Maximize code provenance guarantees and efficiency of security response,” read the provenance discussion; focus on why private matching PDBs and source information must be archived with the build.
For the current course stage, use a mitigation matrix like this:
| Mitigation / property | Build setting or source | PE evidence | Runtime evidence | Record as |
|---|---|---|---|---|
| Stack cookie | /GS | Security-cookie-related metadata where applicable; compiler/linker log | Crash behavior only if observed | enabled / disabled / unknown |
| ASLR | /DYNAMICBASE | PE DLL characteristics | Loaded module base across launches | enabled / disabled |
| High-entropy ASLR | /HIGHENTROPYVA | PE characteristics | x64 observed base variation | enabled / disabled / not applicable |
| DEP compatibility | /NXCOMPAT | PE DLL characteristics | Process DEP policy if collected | enabled / default x64 behavior / unknown |
| CFG | /guard:cf at compile and link | Guard flags/load-config metadata | Process CFG policy | enabled / disabled / unknown |
| CET compatibility | /CETCOMPAT | Image compatibility metadata | User shadow-stack policy and hardware support | compatible / active / inactive / unknown |
| EH continuation protection | /guard:ehcont | EH continuation metadata | Relevant process policy where applicable | enabled / disabled / unknown |
| SafeSEH | /SAFESEH | x86-only feature | — | not applicable on x64 |
Two rules keep this table honest:
- Do not infer compiler instrumentation solely from a source-project checkbox. Preserve the actual command line or build log and inspect the resulting image.
- Do not equate an image opt-in with active runtime enforcement. An image can be CET-compatible while a process has no active user-mode shadow-stack policy.
Detailed interpretation of CFG, CET, XFG, EH continuation protection, ACG, and CIG follows in the later mitigation module. Here, your immediate objective is to collect enough evidence that future testing is performed against a known policy state.
To capture process policy for a running laboratory target, start it in a controlled run and save the raw output:
$p = Start-Process `
    -FilePath "D:\Lab\NativeLab\bin\NativeLabPlain.exe" `
    -ArgumentList '"D:\Lab\cases\case-001.bin"' `
    -PassThru

Get-ProcessMitigation -Id $p.Id |
    Out-File -Encoding utf8 ".\case-001-process-mitigations.txt"
If your target is GUI-driven, launch it normally, identify the intended process ID, and run the same command before triggering the crash. Record the command output verbatim as an attachment and summarize only the relevant settings in the main record. Do not silently substitute system defaults for process-specific evidence.
4. Make symbol provenance part of target identity
A matching PDB is not a convenience; it affects the credibility of source lines, local variables, function names, and unwound stack frames. Microsoft public symbols help interpret Windows components, but they do not replace the private PDB for your own target build.
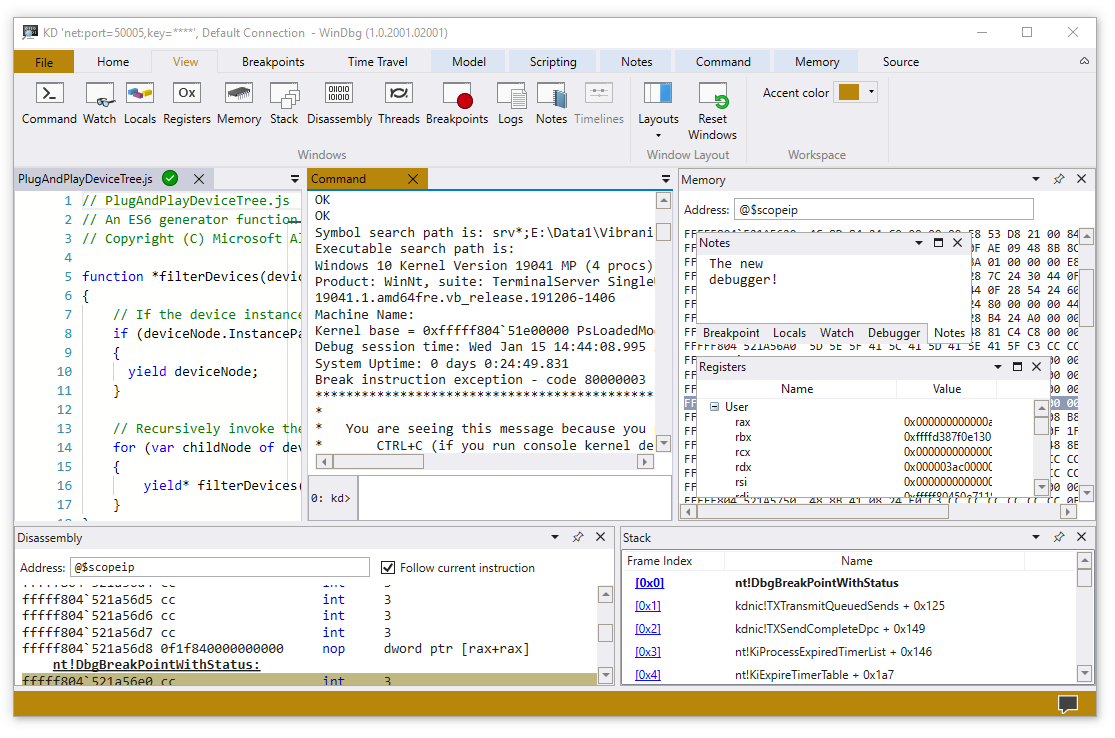
Use a controlled symbol path that combines a cache, Microsoft’s symbol server, and your archived private symbols:
.symfix C:\Symbols
.sympath+ D:\Lab\NativeLab\symbols
.reload /f NativeLabPlain.exe
.sympath
lmv m NativeLabPlain
!lmi NativeLabPlain
.srcpath
Record at least:
- the active symbol path from
.sympath; - the source path from
.srcpath, if source debugging is used; lmv m NativeLabPlainoutput, including Symbol Type, Symbol Status, and Symbol File Name;- the private PDB’s archival path;
- PDB signature and age when available from image/module information;
- whether target source lines are available, unavailable, or suspected mismatched;
- the symbol-server/cache paths used for Windows modules.
A correct PDB match should resolve your target’s crash location consistently in ln @rip, uf @rip, and kv. A superficially plausible function name is not enough evidence on its own.
Introduction to Windbg Series 1 Part 3 - Introduction To debug Symbols
Watch “Introduction to Windbg Series 1 Part 3 - Introduction To debug Symbols” by TheSourceLens for a compact demonstration of symbol-path setup, reloading, module symbol status, and address-to-symbol lookup.
Watch the WinDbg workflow. Focus on the purpose of the local symbol cache, the .reload step, lmv for loaded-PDB status, and the complementary roles of x and ln. In your record, preserve the observed lmv status rather than merely writing “symbols loaded.”
A useful practical distinction:
NativeLabPlain!ReadField+0x34means a symbol was found.NativeLabPlain+0x1234means the module is known but no function-level target symbol was resolved.- A source line and
dv /tlocals may require more complete debug information than a simple function name.
For later exploit analysis, the most important failure mode is an accidental target/PDB mismatch. If the PDB is not demonstrably tied to the target binary, write symbol reliability: unverified and avoid treating source-level values as facts.
5. Specify the trigger as carefully as the executable
A crash reproducer needs an identity, a transport, and a procedure.
For a file-processing target, record:
$input = "D:\Lab\cases\case-001.bin"
Get-Item $input | Select-Object FullName, Length, LastWriteTimeUtc
Get-FileHash $input -Algorithm SHA256
Then state:
- the input filename and SHA-256;
- input size;
- generator or mutator script version and arguments, if applicable;
- delivery surface: command-line file argument, File Open dialog, drag-and-drop, clipboard, plugin, or IPC;
- exact launch command line;
- UI actions, in order, if a GUI operation is required;
- any necessary timing, wait condition, or configuration state;
- whether a fresh process is required;
- whether the crash occurs under a debugger, without one, or both.
For example:
Input:
  ID: case-001
  Path: D:\Lab\cases\case-001.bin
  SHA-256: <record actual digest>
  Size: 4,112 bytes
  Delivery: File > Open, then select case-001.bin
  Required setting: “Preview records” enabled
  Target launch: NativeLabPlain.exe
  Process state: clean launch; no previously opened documents
Avoid descriptions such as “open the malformed file.” They do not identify the file or clarify whether a parser path was entered through command-line processing, a dialog callback, a preview handler, or a plugin.
6. Define a stable crash signature
Absolute virtual addresses vary under ASLR, and raw stack addresses vary with thread and process layout. Therefore, a crash signature should use normalized properties.
For an image mapped at runtime base , with exception-time instruction pointer , the image-relative location is:
For the exact same binary, this RVA remains stable across ordinary ASLR relocations. A symbolic function-plus-offset, such as NativeLabPlain!ReadField+0x34, is often more readable, but it depends on trustworthy symbols. Preserve both when possible.
Run this evidence-capture sequence in WinDbg after opening the dump:
!analyze -v
.exr -1
.ecxr
r
ln @rip
u @rip L8
kv
lmv m NativeLabPlain
!lmi NativeLabPlain
Using the Analyze Extension - Windows drivers
Read Microsoft’s user-mode !analyze -v example as a guide to the fields that belong in a concise crash signature. The automated analysis is a starting point: confirm its claims against the exception record, exception context, disassembly, and matching symbols.
In “A User-Mode !analyze -v Example,” begin with the command’s purpose. Then follow the user-mode example from the FAULTING_IP output through BUCKET_ID. Pay particular attention to the displayed exception record, process name, symbolic fault location, and STACK_TEXT; the example explains that the stack and symbol fields are debugger-produced evidence you can repeat with .ecxr ; kb.
A robust expected signature contains the following:
| Field | Example form | Why it is stable/useful |
|---|---|---|
| Exception | 0xC0000005 | Distinguishes access violation from a fail-fast, breakpoint, or other exception. |
| Access operation | read, write, or execute | Comes from the exception parameters and faulting instruction. |
| Fault module | NativeLabPlain.exe | Identifies the responsible image. |
| Normalized fault location | NativeLabPlain!ReadField+0x34; RVA recorded separately | Survives ASLR if the binary and symbols match. |
| Faulting instruction | movzx eax, byte ptr [rax+rdx] | Captures the actual machine operation. |
| Top stack frames | normalized module/function/offset frames | Distinguishes parser routes reaching similar faults. |
| Trigger identity | case-001 plus input hash | Connects the crash to exact bytes and delivery method. |
| Build identity | target SHA-256 | Prevents cross-build comparison. |
Do not use the following as the sole signature:
- the absolute
RIPvalue; - a Windows Error Reporting bucket ID;
- a single function name without offset;
- the first stack frame alone;
- a debugger screenshot;
- “crashes reliably.”
Those can be helpful supplementary artifacts, but none uniquely defines a reproducible laboratory failure.
A compact expected-signature entry might look like this:
Expected crash signature:
  Exception: 0xC0000005, invalid read
  Fault module: NativeLabPlain.exe
  Fault location: NativeLabPlain!ReadField+0x34
  Fault RVA: 0x0000000000012A34
  Faulting instruction: movzx eax, byte ptr [rax+rdx]
  Top normalized frames:
    NativeLabPlain!ReadField+0x34
    NativeLabPlain!ParseRecord+0x91
    NativeLabPlain!OpenDocument+0x1C8
  Symbol requirement: private PDB matches target SHA-256
  Acceptance rule: all fields above match; absolute addresses may differ
The expected signature is a prediction made before a later run. The observed signature is the evidence captured from that run. Keeping them separate exposes drift immediately: an input may still crash, but in a different parser function, with a different exception type, or only after a target rebuild.
7. Assemble the record: concise, attached to evidence, reproducible
Use one lab record per target/input/crash case. Markdown is practical because it accommodates prose, command output attachments, and version control.
# Lab case: case-001 — baseline invalid read

## Scope and environment
- Purpose: reproduce an intentional laboratory parser crash.
- VM snapshot: WS2022-ExploitLab-Base-01
- OS: Windows Server 2022, build <record actual build>
- Debugger: WinDbg <record version>
- Run type: clean process launch; user-mode full dump.

## Target build identity
- Executable: D:\Lab\NativeLab\bin\NativeLabPlain.exe
- SHA-256: <actual digest>
- Architecture: x64
- Build configuration: Release|x64
- Source revision: <commit or archive ID>
- Compiler/linker: <actual versions>
- Build-log attachment: build-case-001.txt

## Mitigation evidence
| Property | Build evidence | PE evidence | Runtime evidence | Status |
|---|---|---|---|---|
| /GS | <command/log> | <inspection result> | n/a | <status> |
| ASLR | <command/log> | <inspection result> | <policy/output> | <status> |
| CFG | <command/log> | <load-config result> | <policy/output> | <status> |
| CET | <command/log> | <PE result> | <policy/output> | <status> |
| EHCONT | <command/log> | <PE result> | <policy/output> | <status> |

- Full PE-inspection attachment: target-headers-loadconfig.txt
- Full process-policy attachment: case-001-process-mitigations.txt

## Symbols and source
- Symbol path: <.sympath output>
- Source path: <.srcpath output>
- Target PDB: <path and load status from lmv>
- PDB identity: <GUID/age if available>
- Windows symbols: Microsoft public server via <cache path>
- Symbol reliability: verified / unverified
- Module-information attachment: lmv-target.txt

## Trigger input and procedure
- Input: D:\Lab\cases\case-001.bin
- SHA-256: <actual digest>
- Size: <actual size>
- Delivery path: <CLI / File Open / drag-and-drop / etc.>
- Reproduction steps:
  1. Launch the target from a clean process state.
  2. Deliver the named input through the stated path.
  3. Save a full user-mode dump at the first-chance/second-chance condition defined for this lab.

## Expected crash signature
- Exception:
- Access type:
- Module and normalized fault location:
- Fault RVA:
- Faulting instruction:
- Required top stack frames:
- Acceptance rule:
- Allowed variability: ASLR-dependent absolute addresses only.

## Observed crash evidence
- Dump: <path and SHA-256>
- !analyze -v attachment:
- .exr -1 output:
- .ecxr register output:
- Disassembly around RIP:
- kv stack:
- Register-to-source reconstruction:
- Match to expected signature: match / mismatch / partial

## Notes and unresolved evidence
- Direct observations:
- Hypotheses:
- Known differences from baseline:
The “Notes and unresolved evidence” section matters. It prevents an early source-level interpretation—such as “the index is attacker-controlled”—from being copied forward as a fact before the input-to-register path has been proven.
A high-quality record is short enough to use during a live debugging session, but complete enough that a clean VM run several weeks later can reproduce the same target, input, and expected crash class.
Key takeaways
A lab record is the reproducibility contract for the rest of the course:
- Identify the target by SHA-256 and architecture, not filename alone.
- Record mitigation evidence in layers: build intent, PE properties, and runtime policy are related but not interchangeable.
- Preserve matching private PDB provenance and loaded-symbol status alongside Microsoft public-symbol configuration.
- Identify inputs by hash and document the exact delivery path and clean-launch conditions.
- Normalize crash signatures using module-relative locations, symbolic offsets, instruction details, and top stack frames—not absolute ASLR-dependent addresses.
- Keep expected and observed signatures separate, and distinguish direct evidence from hypotheses.
The next module moves beneath these artifacts into PE loading and process memory: how image sections, directories, relocations, mapped regions, and loaded DLLs explain the addresses that appear in your crash records.
Can't find a good explanation? Sign up and we'll make it for you
Sign up