
Hello! Welcome to your next lesson in the "Strategic Budget Allocation and Financial Forecasting" module.
In our last session, we focused on how to construct a persuasive, data-driven business case to justify a budget increase or reallocation. We learned to frame marketing as an investment and to speak the language of finance, using the one-page capital brief as our core tool. A key part of that justification was identifying saturated channels to cut from and high-growth channels to invest in, based on marginal ROI.
Today, we're going to dive into the analytical engine behind those recommendations. Your learning outcome for this lesson is to model the financial impact of scaling or cutting budget in a specific channel. You'll learn how to use the outputs of analytical models, like the response curves from Marketing Mix Modeling (MMM), to forecast the real-dollar consequences of your budget decisions. This is the "how-to" behind the strategic "what" and "why" we discussed previously.
1. The Underpinning Principle: The Law of Diminishing Returns
Before we apply this to marketing, let's start with the fundamental economic principle that governs all resource allocation: the law of diminishing returns. You've likely encountered this concept intuitively, but understanding its formal definition is key. In simple terms, if you keep adding more of one ingredient while keeping others constant, the benefit you get from each new addition will eventually start to shrink.
To get a clear, non-technical introduction to this idea, let's watch a short video that explains it using a simple factory analogy.
Diminishing Returns and the Production Function- Micro Topic 3.1
The video 'Diminishing Returns and the Production Function' from Jacob Clifford provides a great, easy-to-understand explanation of this core economic concept. It uses the example of a pizza shop to illustrate the relationship between inputs (like workers) and outputs (pizzas).
Please watch from 01:29 to 03:31. As you watch, focus on how the presenter calculates 'marginal product'—the additional output from one more unit of input—and how it changes as more workers are added. This is the direct parallel to the 'marginal ROI' we've been discussing.
The key takeaway is that output doesn't increase in a straight line with input. After an initial phase of specialization (or "warming up" a channel), you hit a point where each additional dollar you spend generates less return than the last. The workers start getting in each other's way; your ad audience becomes saturated. This is not failure—it's a natural and predictable economic law.
2. Visualizing Diminishing Returns: The Marketing Response Curve
In marketing, we visualize this principle using a marketing response curve. This is the primary tool for modeling the impact of budget changes.
- The X-axis represents your input: Marketing Spend.
- The Y-axis represents your output: A business outcome like Revenue, Conversions, or Sales.
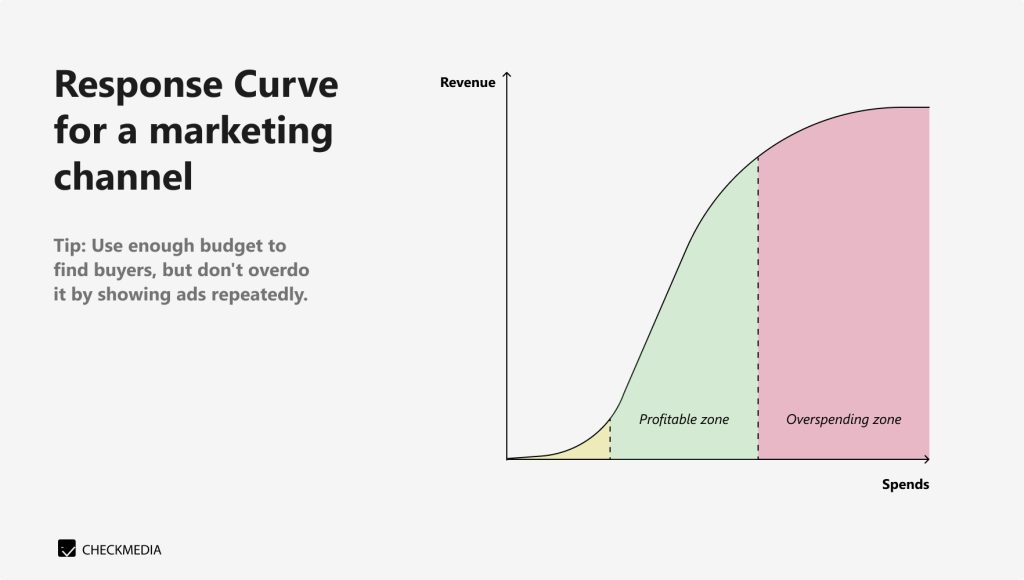
This curve is not a theoretical sketch; it's a a statistical model output, typically generated by a Marketing Mix Model (MMM), which analyzes historical data to define this relationship for each of your channels.
To connect the economic theory to marketing practice, let's explore how this is formalized.
Diminishing returns in marketing: when your next euro delivers ...
The article 'Diminishing returns in marketing' from Analytical Alley explains how this concept is directly applied in a marketing context. It introduces the idea of the saturation curve, which is the technical name for the response curve.
Please read the first two sections, 'What diminishing returns actually mean in B2C marketing' and the paragraph below it that starts with 'A typical Hill saturation function...'. You don't need to memorize the formula, but understand its purpose: to mathematically describe the S-shaped curve of diminishing returns.
3. How to Model the Financial Impact
Now for the core task: using the response curve to forecast the impact of a budget change. The process is surprisingly straightforward once you have the curve. It's about locating your current position and then reading the chart to see what happens when you move left (cut) or right (scale).
The Most Important Distinction: Average vs. Marginal ROI
Before we model, we must reinforce a critical concept. As a leader, you will constantly face this distinction.
- Average ROI: Total Return / Total Spend. This tells you the overall performance of a channel.
- Marginal ROI: Return from the next dollar spent. This tells you if you should invest more.
A channel can have a fantastic average ROI but a terrible marginal ROI if it's already saturated. All decisions about scaling or cutting should be based on marginal ROI.
Diminishing returns in marketing: when your next euro delivers ...
Let's return to the 'Diminishing returns in marketing' article to solidify this point. Misunderstanding this is one of the most common and costly mistakes in budget allocation.
Please read the section 'Avoiding common pitfalls when interpreting response curves'. Pay close attention to the first point about confusing average with marginal ROI.
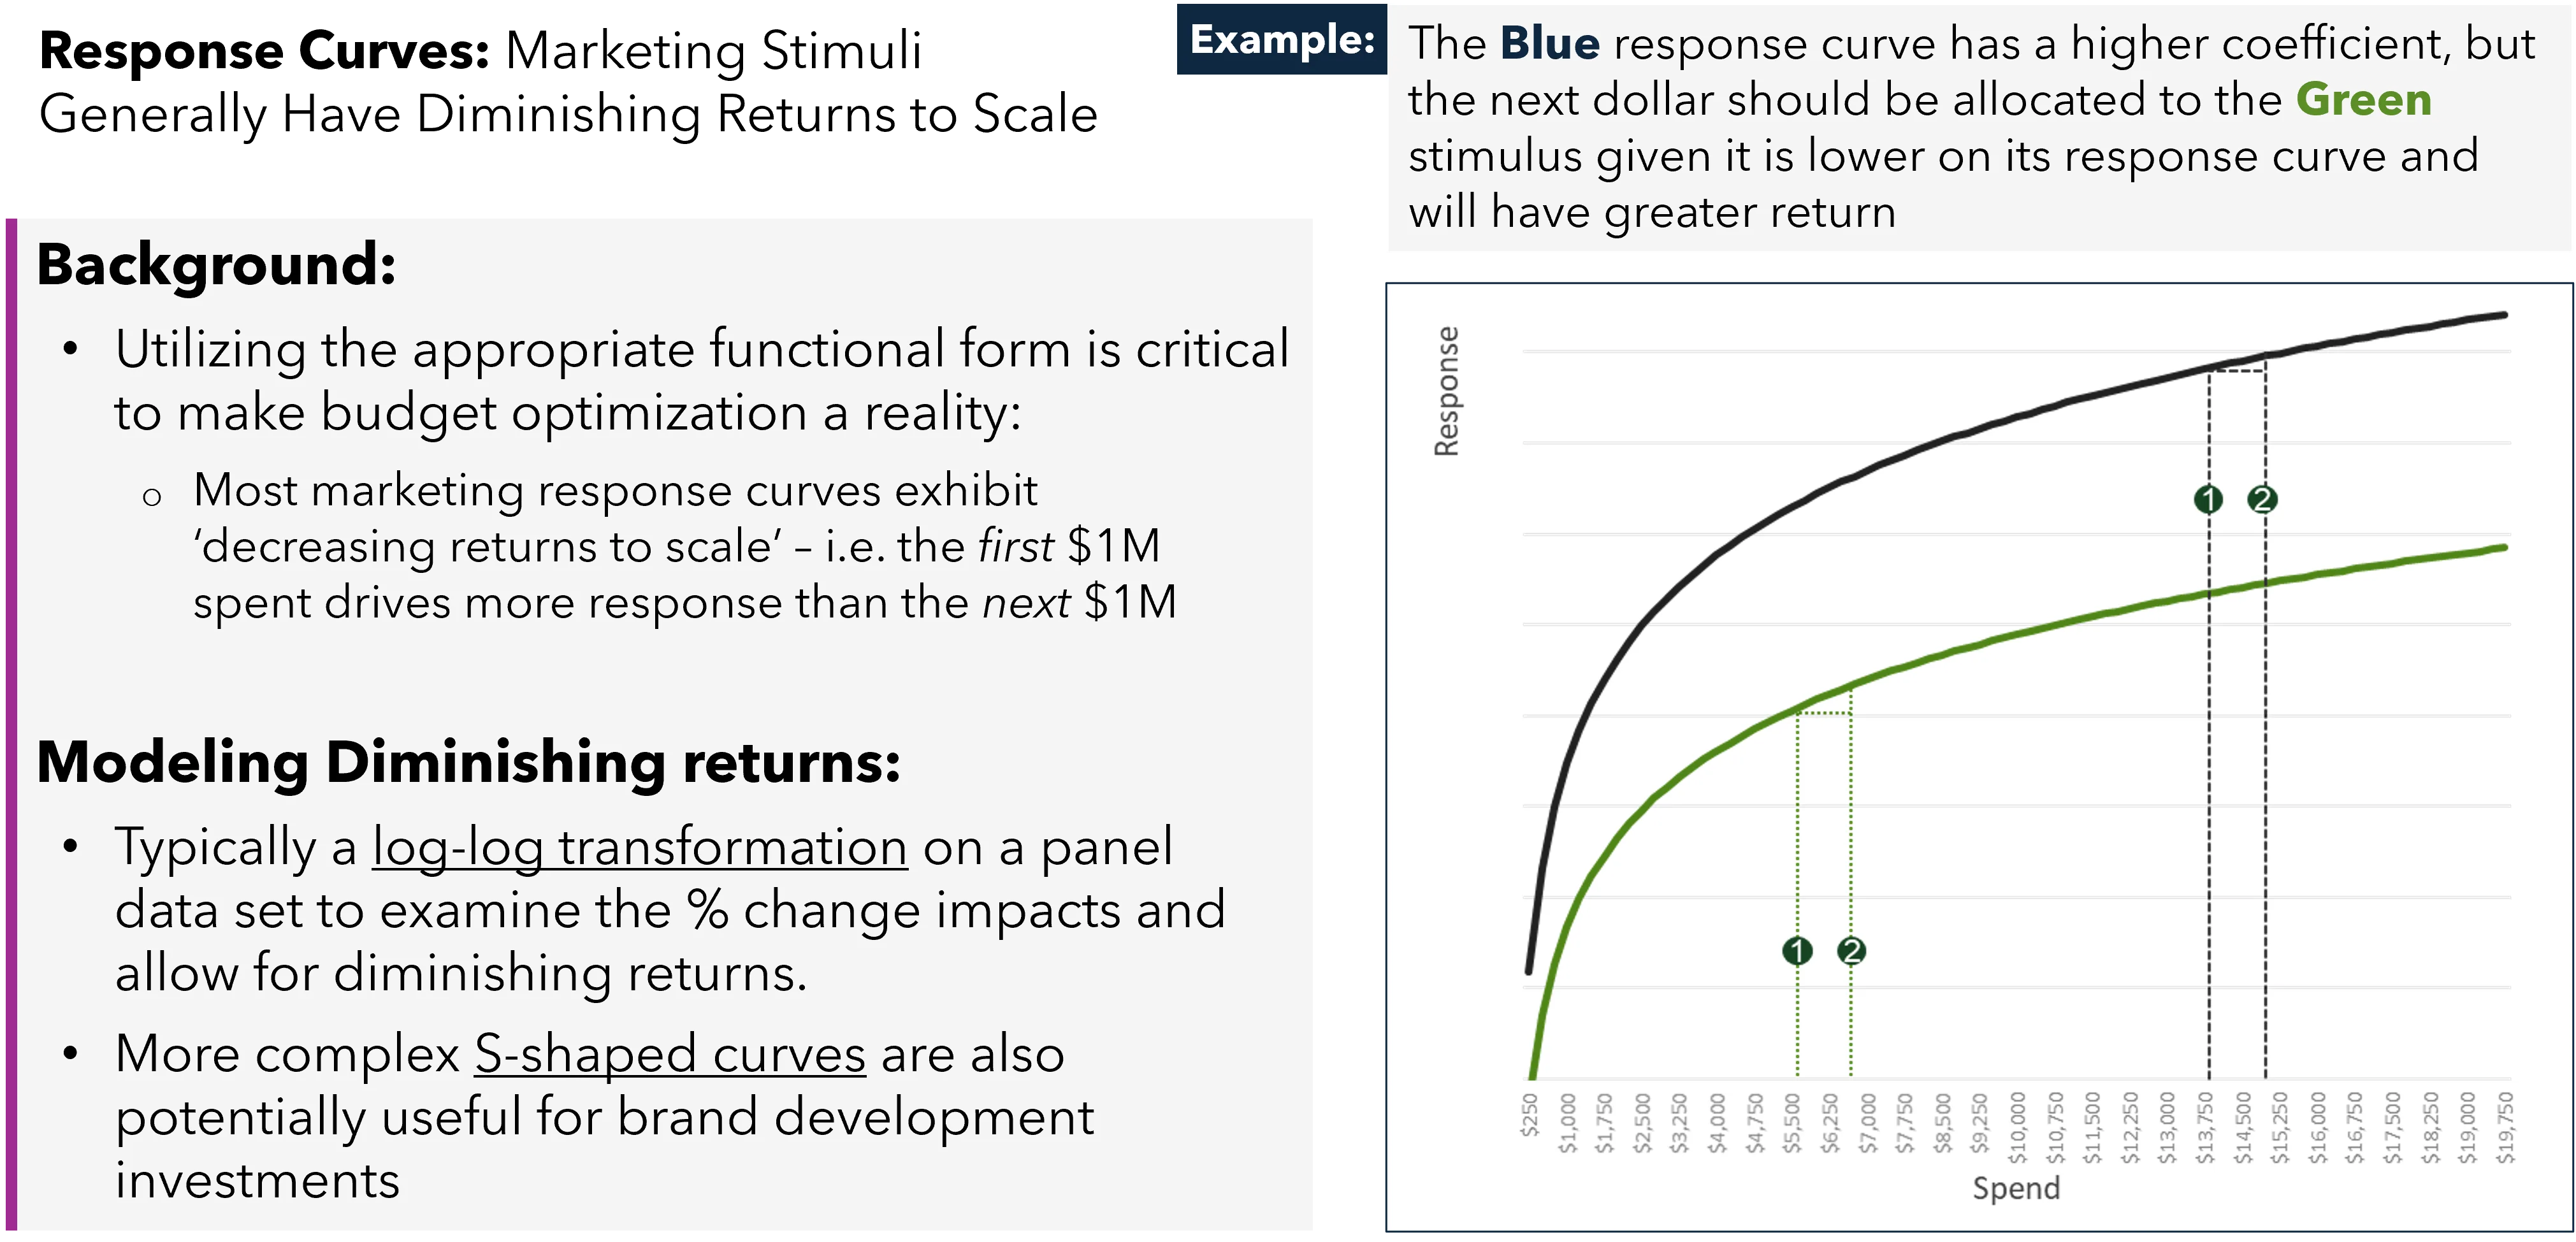
This image powerfully illustrates the concept. To maximize your total return, you should allocate your next dollar not necessarily to the channel that performs best overall (black curve), but to the one that will give you the biggest lift from that next dollar (green curve).
The Forecasting Process
With a response curve for a channel, modeling the financial impact is a two-step process:
- Locate Your Current Position: Find your current spend level on the x-axis and the corresponding revenue/conversion level on the y-axis.
- Simulate the Change:
- To model scaling: Move to the right on the x-axis to your proposed new budget. The new point on the y-axis is your forecasted outcome. The financial impact is the difference between the new and original outcomes.
- To model cutting: Move to the left on the x-axis. The new, lower point on the y-axis is your forecast. The financial impact is the (hopefully small) amount of revenue you will lose.
Modern MMM platforms do this for you, running thousands of simulations to find the optimal budget mix. As a leader, you don't need to run the simulation, but you must understand how to interpret its output to make the final call.
Marketing budget allocation: Optimizing ROI across channels ...
The article 'Marketing budget allocation' provides a clear, practical framework for how these simulations are used to build reallocation scenarios.
Please read the subsection titled '3. Build reallocation scenarios'. Notice how it translates the theory directly into action: testing shifts from saturated channels to those with room for growth and modeling the impact.
The case studies in these articles are excellent examples of the final output you would be working with:
- "reallocating 20% of paid search spend... increased total incremental sales by 13% without adding a single euro to the budget."
- "reducing Facebook from €7,000 to €4,000... and reallocating €3,000 to programmatic display... increased incremental sales by 18% with zero budget increase."
These quantified impacts are the direct result of modeling with response curves.
Test your understanding!
Your analytics team provides you with the response curve for your Meta Ads campaigns.
- Your current monthly spend is $100,000, which generates $400,000 in incremental revenue (a 4x average ROI).
- The model shows that increasing spend to $120,000 would generate $440,000 in incremental revenue.
- The model shows that cutting spend to $80,000 would generate $340,000 in incremental revenue.
- What is the financial impact (in dollars) of scaling the budget by $20,000? What is the marginal ROI of this increase?
- What is the financial impact of cutting the budget by $20,000? What is the marginal revenue loss per dollar cut?
Show answer
-
Scaling Impact:
- Financial Impact: $440,000 (new revenue) - $400,000 (current revenue) = $40,000 in additional revenue.
- Marginal ROI: $40,000 (additional revenue) / $20,000 (additional spend) = 2.0x. Notice this is much lower than the 4.0x average ROI, indicating the channel is starting to saturate.
-
Cutting Impact:
- Financial Impact: $400,000 (current revenue) - $340,000 (new revenue) = $60,000 in lost revenue.
- Marginal Revenue Loss: For the $20,000 cut (from $100k to $80k), we lost $60,000. This means that portion of the budget was working at a 3.0x marginal ROI ($60k / $20k). This tells you that cutting this channel would be more painful than scaling it would be beneficial at this specific point.
Conclusion
You are now equipped to go beyond simply approving a budget and can now intelligently model and question the financial impact of your team's spending decisions. By understanding the interplay of diminishing returns, response curves, and marginal ROI, you can guide your team to allocate capital with precision, maximizing growth and minimizing waste.
Key Takeaways:
- Diminishing Returns are Universal: All marketing channels eventually saturate. Scaling or cutting budget has a non-linear impact that must be modeled.
- Response Curves are Your Forecasting Tool: These curves, derived from MMM, are the key to predicting the revenue impact of budget changes.
- Marginal ROI is the Deciding Metric: Always base decisions to scale or cut on the return from the next dollar, not the overall average.
- Modeling is a "What If" Exercise: The process involves using the curve to simulate the outcome of increasing or decreasing spend from your current position.
Preview of the Next Lesson:
This lesson concludes our module on Strategic Budget Allocation and Financial Forecasting. You've learned to synthesize data, build a business case, and now, to model the financial impact of your decisions. The final piece of the leadership puzzle is communication.
In our next lesson, we will kick off a new and crucial module: "Data Storytelling and Stakeholder Influence." We will begin by learning how to structure a compelling narrative that connects analytical findings to specific business outcomes, ensuring your hard-won insights resonate with, and influence, any audience.