
Welcome back. In the previous lesson, you learned to check who is making a claim, what evidence they provide, and whether independent sources support it. This lesson adds a crucial safeguard: even a well-sourced report can describe a real pattern and still overstate what caused it.
In crime reporting, psychology, public health, and everyday conversation, people often spot two things occurring together and leap to a neat story about why. A disciplined investigator treats a pattern as a lead to examine, not as a verdict. You will learn to identify correlation, distinguish it from causation, and challenge causal headlines with plausible alternatives.
Association is not explanation
A variable is anything that can differ across people, places, or times: hours of sleep, number of patrols, school attendance, reported assaults, stress level, or social-media use.
A correlation is a relationship between two variables. When one changes, the other tends to change in a predictable way too. This can be useful: correlations can help us describe patterns and make limited predictions.
For example:
- Taller people tend, on average, to weigh more than shorter people.
- People who report more hours of sleep tend, on average, to report less daytime tiredness.
- Shoe size and hours of sleep do not show a meaningful relationship.
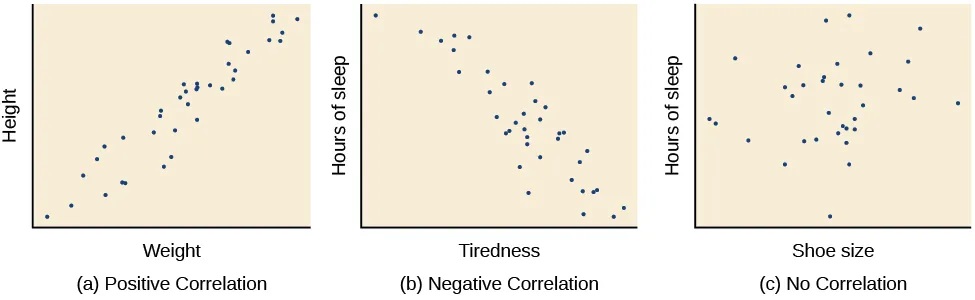
A scatterplot represents each observation as one dot. We look at the overall pattern, not at any individual dot.
- A positive correlation means the variables tend to move in the same direction. As one rises, the other tends to rise; as one falls, the other tends to fall.
- A negative correlation means they tend to move in opposite directions. As one rises, the other tends to fall.
- No correlation means there is no consistent linear pattern between them.
The word “positive” does not mean good, and “negative” does not mean bad. A positive correlation between temperature and heat exhaustion would be a bad outcome; a negative correlation between sleep and tiredness is generally desirable.
Researchers often summarize a linear correlation with a correlation coefficient, written as . It ranges from to :
The sign shows direction. The distance from zero shows strength.
| Correlation coefficient | Meaning |
|---|---|
| Strong positive relationship | |
| Moderately strong negative relationship | |
| Weak positive relationship | |
| No linear relationship |
A stronger correlation can improve prediction, but it still does not explain why the variables are associated. That distinction is the centre of this lesson.
2.3 Analyzing Findings - Psychology 2e | OpenStax
Read OpenStax Psychology 2e’s explanation of correlational research. It gives the basic vocabulary for reading scatterplots and explains why a relationship between variables is not yet a cause-and-effect finding.
In the subsection “Correlational Research,” read from correlation basics. Focus on the difference between direction and strength, and on what a scatterplot can show. Then, in “Correlation Does Not Indicate Causation,” read the limitation. Finish with “Illusory Correlations,” especially the explanation beginning why false patterns persuade us.
Causation makes a much stronger claim
Causation means that changing one factor produces a change in another factor. If causes , then makes some difference to whether, how often, or how strongly occurs, given the relevant conditions.
Compare these statements:
“People who regularly attend a youth club are less likely to be arrested.”
This is an association claim. It may be based on a genuine dataset.
“Attending a youth club reduces offending.”
This is a causal claim. It says that attendance itself produces the reduction.
The second statement may turn out to be true, but the first statement does not establish it on its own. Before accepting the causal story, we need to consider other explanations.
A useful rule is:
Correlation tells you that a pattern exists. Causation tells you why the pattern exists.
The mistake is not noticing a correlation. The mistake is treating the correlation as if it settles the explanation.
The ice-cream and sunburn example makes the point clearly.
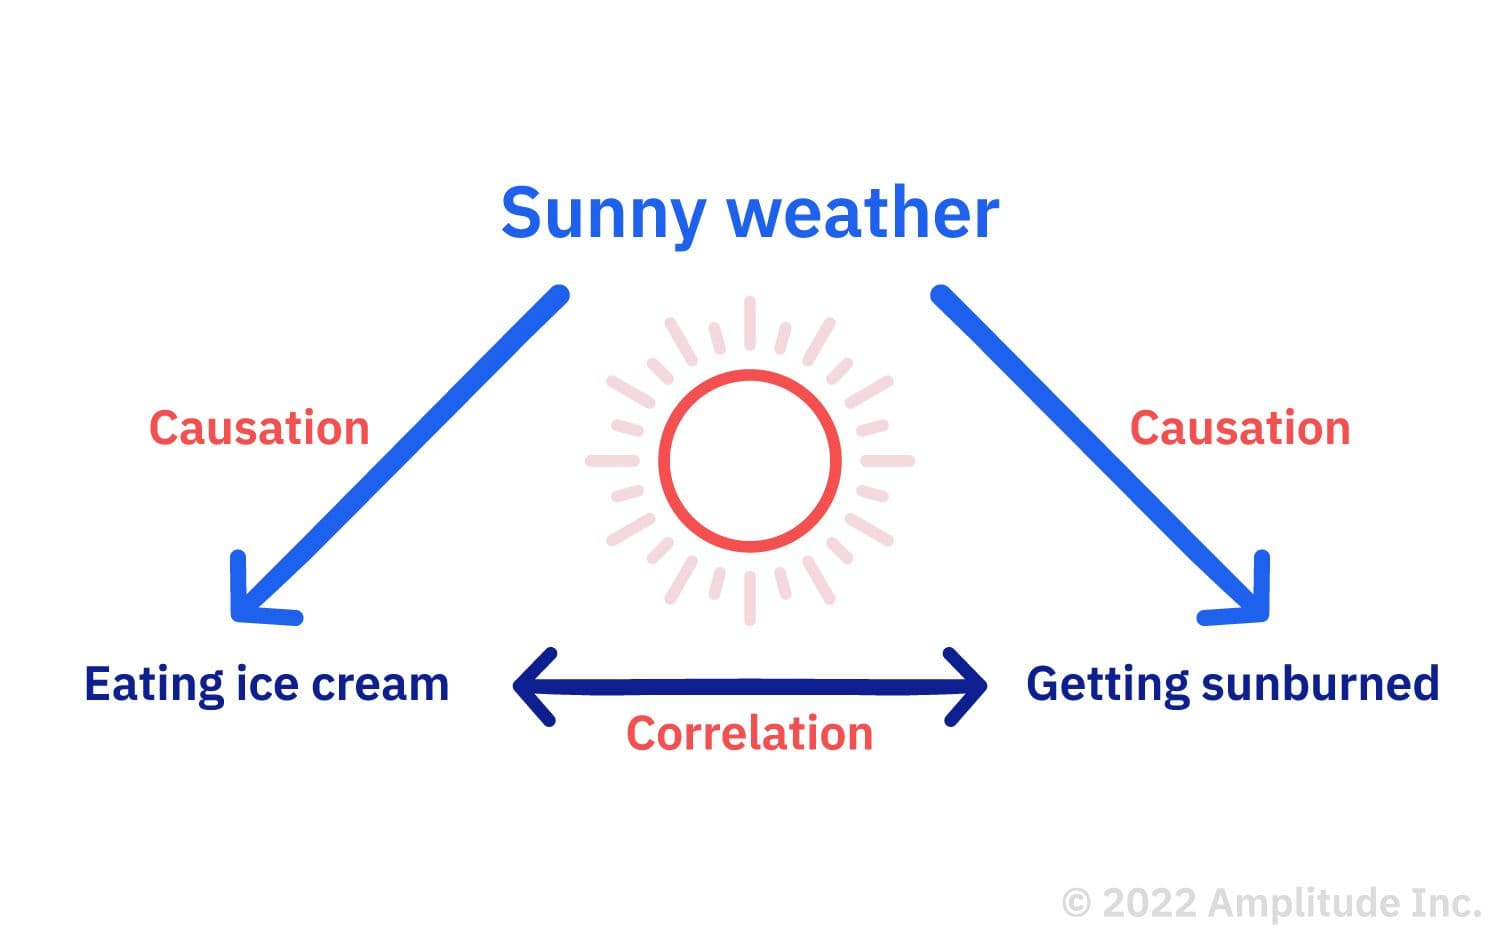
Here, ice-cream consumption and sunburn can rise together. But the better explanation is that sunny weather affects both. Sunny weather is a confounding variable, sometimes called a third variable.
Four alternatives to a tempting causal story
When a report says that and are related, pause before deciding that causes . At least four broad explanations are possible.
1. Direct causation
It may genuinely be the case that helps cause .
For example, increased alcohol impairment can reduce reaction time and judgement. There is a plausible mechanism, and this claim can be tested under controlled conditions.
But direct causation is only one possible explanation, not the default conclusion.
2. Reverse causation
Perhaps causes , rather than the other way around.
Suppose a report finds that neighbourhoods with higher crime reports have more CCTV cameras. It would be wrong to conclude immediately that CCTV causes crime. A more obvious possibility is that areas experiencing higher crime install more cameras in response.
This does not show CCTV has no effect. It shows that the observed relationship alone cannot reveal the direction of causation.
3. Confounding: a third factor affects both
A confounder is a factor connected to both variables that can create or distort their apparent relationship.
Imagine that students who eat breakfast regularly also tend to have higher school attendance. It would be premature to say breakfast causes attendance. Other factors might affect both, such as household routine, transport, food security, parental work schedules, sleep, or general health.
The same issue matters in crime and behaviour reports. Consider this claim:
“Areas with more police patrols have more recorded crime.”
Possible explanations include:
- Police may be deployed where crime was already higher.
- Greater police presence may detect and record more offences.
- Local businesses, transport hubs, nightlife, population density, or reporting practices may affect both patrol levels and recorded incidents.
- The relationship may differ by offence type and time of day.
The correlation is still potentially useful. It may tell decision-makers where to investigate. It does not tell them that patrols produce crime.
4. Chance, measurement problems, or an illusory correlation
Sometimes a pattern is weak, temporary, or produced by chance. Sometimes it exists mainly because data are measured badly or selectively.
An illusory correlation occurs when people believe two things are related despite no reliable relationship being present. This can happen because memorable events stand out. Someone may remember the one full-moon night when a strange incident occurred and forget all the ordinary full-moon nights, as well as strange incidents on other nights.
This is dangerous when people turn selective memories into claims about groups:
“Every time I see people from group X, they are behaving suspiciously.”
That is not systematic evidence. It may reflect who was noticed, where observations occurred, what counts as “suspicious,” and which examples were remembered. Such thinking can feed stereotypes and unfair decisions.
A practical test for reports about behaviour
Headlines often turn cautious research language into confident causal language. Watch for verbs such as:
- causes
- leads to
- makes people
- reduces
- prevents
- drives
- fixes
- creates
Those words are not automatically wrong. They signal that the writer is making a claim that needs stronger evidence than a simple survey or comparison.
| What the evidence may support | What it may not yet support |
|---|---|
| “Heavy social-media use was associated with lower life satisfaction.” | “Social media makes users unhappy.” |
| “Areas with more officers had more recorded drug offences.” | “More officers create drug offending.” |
| “Young people who joined a programme had fewer later exclusions.” | “The programme caused fewer exclusions.” |
| “People reporting poor sleep also reported more stress.” | “Poor sleep alone caused their stress.” |
A headline that uses “linked with,” “associated with,” or “goes together with” is usually making a more careful claim than one that says “causes.” Even then, inspect what was measured, who was studied, and what alternative explanations remain.
This short Khan Academy video models the habit of questioning an appealing causal headline rather than assuming that the study supports it.
Correlation and causality | Statistical studies | Probability and Statistics | Khan Academy
Watch “Correlation and causality” from Khan Academy. The presenter uses a breakfast-and-obesity headline to separate what a study observed from what journalists and readers may infer from it.
Start with the distinction, where correlation and causation are defined side by side. Then watch alternative explanations. Notice the three moves: reverse the proposed direction, look for a third variable, and resist giving advice that the evidence has not earned.
A compact mental routine for any causal headline is:
- State the observed correlation precisely. What two variables were related, in which group, over what period?
- Identify the claimed cause. What is the article saying produces what?
- Reverse the direction. Could the outcome be influencing the supposed cause?
- Search for shared causes. What circumstances could influence both variables?
- Check the design. Did researchers merely observe people, or did they use a credible comparison that addresses alternatives?
- Match confidence to evidence. Use cautious language when the evidence is correlational.
This is not excessive scepticism. It is protection against acting on a story that may be incomplete or backwards.
A real example: social media and well-being
The relationship between social-media use and well-being is often presented in blunt terms: “social media is harming young people” or “screen time causes unhappiness.” The evidence is more complicated.
Our World in Data reviews survey, longitudinal, and experimental research on this question. Survey comparisons can find that people who use social media more heavily report lower satisfaction. That is a correlation worth studying, but it leaves crucial questions unanswered:
- Are some people already stressed, isolated, or unhappy more likely to use social media heavily?
- Do age, gender, family circumstances, offline relationships, or type of online activity alter the pattern?
- Is “hours reported on an app” a precise measure of meaningful social-media use?
- Might the relationship run both ways?
Are Facebook and other social media platforms bad for our well-being? | Our World in Data
Read this Our World in Data analysis as an example of careful reasoning about human behaviour. It shows why the same broad question can produce different correlations depending on measures and groups, and why observational evidence should not be oversold.
In “Comparisons across individuals,” read the survey comparison. Focus on how different measures and analytical choices can change the result. Next, under “Studies of social media use and well-being over time,” read from the longitudinal evidence. Note the idea of a reciprocal relationship: each factor may influence the other. Finally, in “Facebook experiments,” read why experiments help, followed by the experimental result. Compare what the experiment can tell us with what the original correlation could tell us.
The evidence reviewed there does not support a simple one-way story. Some longitudinal findings suggest a small reciprocal relationship: higher use can precede lower life satisfaction, while lower life satisfaction can also precede higher use. An experiment in which participants were randomly selected to stop using Facebook for four weeks found small improvements in some self-reported well-being measures.
The key reasoning lesson is not “social media is harmless” or “social media is harmful.” It is that a causal conclusion needs to fit the actual evidence. A survey correlation might identify a concern. Better designs are needed to estimate whether changing social-media use itself changes well-being, for whom, and by how much.
What evidence supports causation more strongly?
No single feature automatically proves causation beyond all doubt. Instead, confidence increases when several lines of evidence make alternative explanations less plausible.
Time order
A proposed cause must come before its effect. If low mood was measured before increased social-media use, it cannot have been caused by that later use.
Time order alone is not enough, but it rules out some claims immediately.
A fair comparison
The central causal question is often counterfactual:
What would have happened to similar people or places if the supposed cause had been absent?
We cannot observe the same individual living two different versions of the same day. Research therefore tries to construct a fair comparison group.
A randomised experiment does this most directly. Participants are randomly assigned to different conditions, making the groups more likely to be similar at the start. If outcomes differ later, the assigned condition becomes a more credible explanation.
Randomised experiments are not always ethical, safe, or practical. You cannot randomly assign people to experience violence, poverty, dangerous driving, or criminal victimisation. In those cases, researchers may use longitudinal studies, natural experiments, matched comparisons, administrative records, or multiple converging studies. These approaches can provide valuable evidence, but they require careful assumptions and remain vulnerable to hidden confounders.
Control of plausible confounders
Researchers can measure known confounders and account for them statistically or through study design. For example, a study of a youth programme might account for prior attendance, age, area deprivation, school exclusions, and previous contact with services.
This improves a study, but it does not guarantee causation. Researchers can only control factors they measured well. Important unmeasured differences may remain.
A credible mechanism
A mechanism is an account of how a cause could produce an effect. It should be more than a vague story.
For example, a claim that better street lighting reduces some offences might be investigated through visibility, guardianship, perceptions of safety, offender decision-making, and changes in pedestrian activity. A plausible mechanism supports a causal explanation, but it cannot replace evidence that the outcome actually changed.
Replication and convergence
Confidence is stronger when different high-quality studies, methods, places, and researchers broadly point in the same direction. A single dramatic study or viral chart should rarely settle an important question.
This returns to the source-evaluation skills from the previous lesson: trace the original study, check who conducted it, inspect its methods, and seek independent corroboration.
Correlation still matters
“Correlation is not causation” does not mean “correlations are useless.”
Correlations can:
- identify risks worth investigating;
- help forecast likely outcomes;
- reveal inequalities or unusual patterns;
- guide where resources or research may be needed;
- test whether an intervention deserves a stronger evaluation.
For instance, if a service finds a correlation between repeat missing-person reports and certain vulnerability indicators, that pattern may help staff identify people who need support. It should not be turned into a deterministic rule about an individual, nor should it be treated as proof that one factor caused another.
Use correlation for description, prediction, and questions. Reserve causal language for evidence that has seriously confronted reverse causation, confounding, measurement issues, and chance.
Key takeaways
A correlation means two variables vary together; it can be positive, negative, weak, or strong. It can help describe patterns and make limited predictions.
Causation is a stronger claim: changing one factor produces a change in another. A correlation alone cannot establish this because the relationship may reflect:
- direct causation;
- reverse causation;
- a confounding third variable;
- chance, faulty measurement, or an illusory correlation.
When reading claims about crime or human behaviour, state the correlation accurately, identify the claimed cause, test reverse direction and confounders, then check the study design. Stronger causal conclusions come from fair comparisons, correct time order, credible control of alternatives, plausible mechanisms, and replication.
Next, you will move from interpreting relationships to interpreting the numbers used in public claims: percentages, rates, averages, and statements of risk.
Can't find a good explanation? Sign up and we'll make it for you
Sign up