
Good to see you again. In the previous lesson, you treated the Tenant Behavioral Detection Platform as a single black box: it receives tenant Microsoft Entra ID sign-in telemetry, relies on a corporate identity service, and serves tenant administrators, SOC analysts, and platform operators. You also identified the trust changes at those external relationships.
Now we zoom in one level. The aim is to construct a C4 container diagram that makes the platform’s major runtime building blocks, data stores, and inter-process relationships reviewable. The result should be detailed enough for engineering and security review, while remaining far above Rust crates, database tables, Kubernetes objects, and API routes.
For this pilot, the diagram must support a defensible story about tenant-scoped investigation, timely impossible-travel detection, source-health visibility, and recovery from processing failures.
A container is a runtime responsibility, not a Docker image
In C4, a container is an independently executable or separately operated unit within a software system. Common containers include:
- a browser-based web application;
- a backend API;
- a background worker;
- a message broker or durable event log;
- a relational database;
- an object store.
“Container” here does not mean a Linux or OCI container. A Rust API deployed to Kubernetes is a C4 container, but so is a managed PostgreSQL database or a Kafka-compatible event log. Conversely, an Axum router, a Rust crate, a PostgreSQL schema, a Kafka topic, or a Kubernetes deployment is usually too detailed for this view.
The container diagram is where an architecture starts to make operational commitments. It answers questions such as:
- Which application performs tenant authorization?
- What isolates ingestion failure from detection processing?
- Where does investigation state live?
- Which container interacts with an external identity provider?
- Which relationships are synchronous API calls, and which are durable asynchronous handoffs?
- Which technologies and protocols must security and operations teams evaluate?
The C4 container view retains directly connected people and external systems from the context diagram, but replaces the system black box with its internal containers.
Visualising software architecture with the C4 model - Simon Brown, Agile on the Beach 2019
Watch Simon Brown’s “Visualising software architecture with the C4 model” from Agile on the Beach. It gives a compact explanation of the Level 2 container view and the notation discipline that makes a diagram useful in a design review.
Watch the container view to see how a system-context box is decomposed into applications, databases, technologies, and runtime connections. Then watch boxes and lines, focusing on concise descriptions, directional relationships, and labels that state what the relationship actually means.
The supplied Internet Banking System example illustrates the change in zoom particularly well.
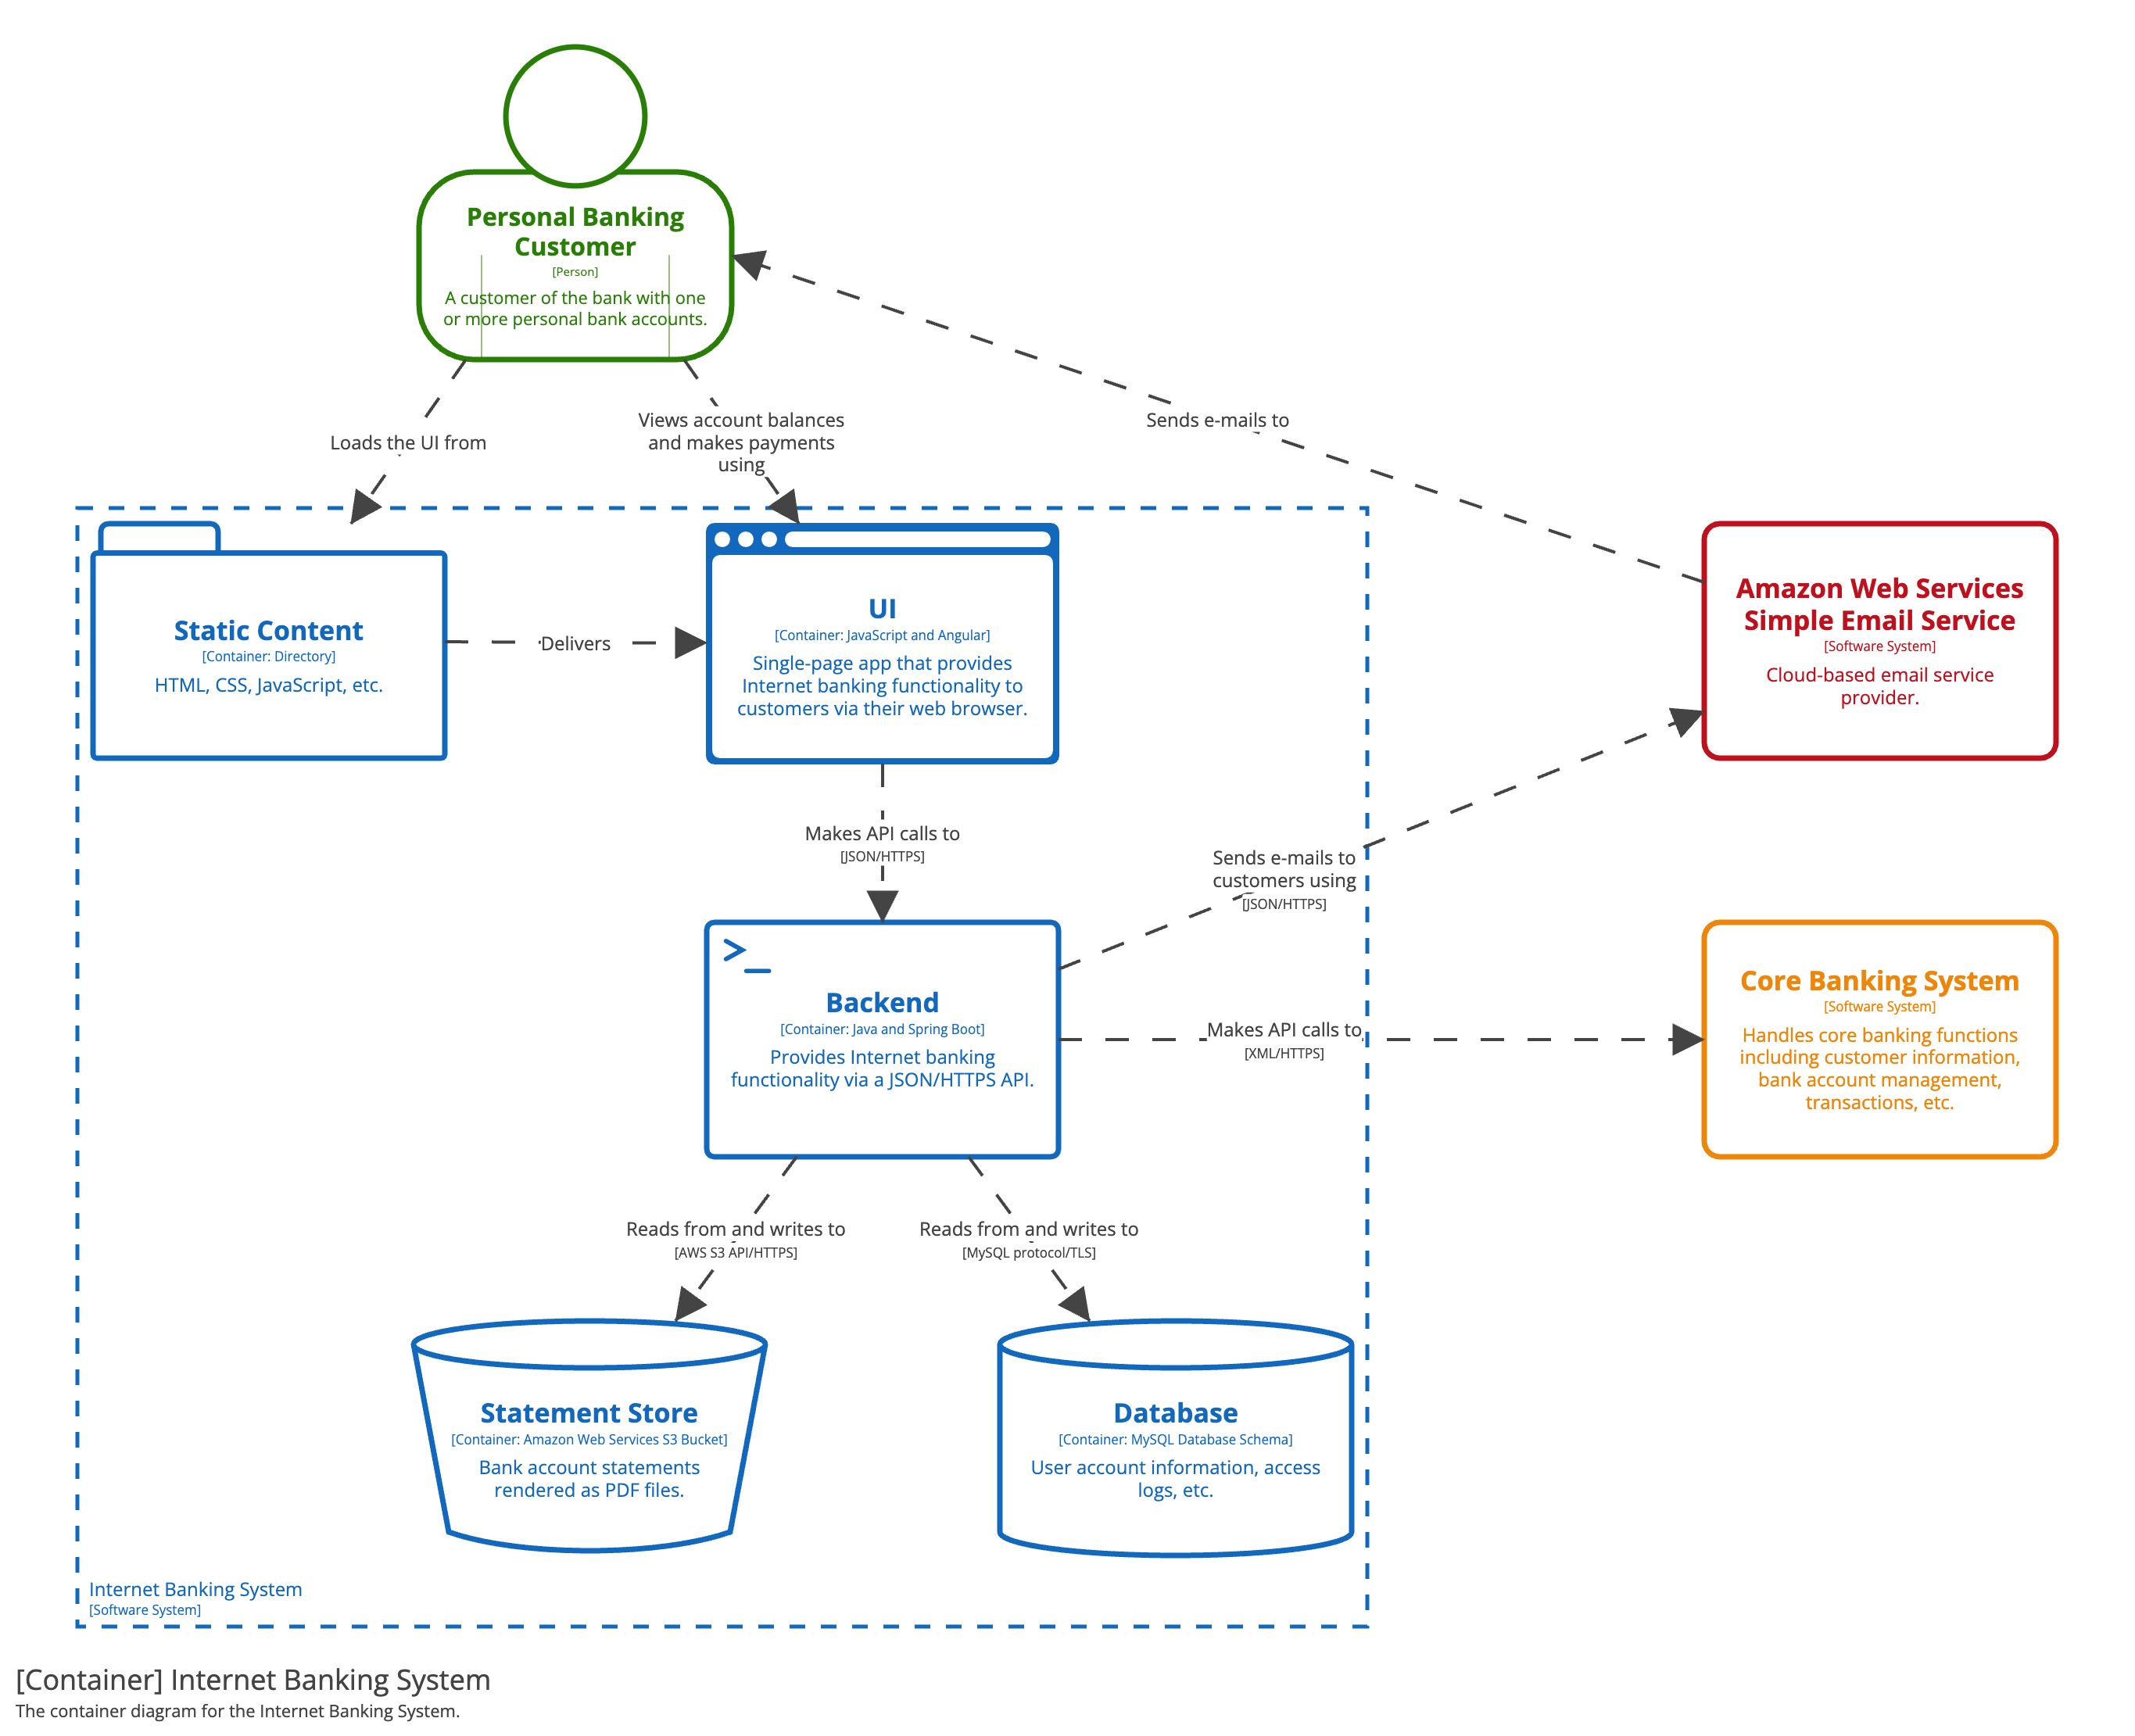
Notice three useful properties:
- Every internal box has a responsibility. “Backend” is still broad, but it is at least named as an application and described as providing JSON-over-HTTP functionality.
- Technology is visible. The UI, backend, relational database, and object store can be assessed by engineers and operators without pretending that a deployment diagram has already been produced.
- The diagram remains selective. It does not show classes, endpoints, cache keys, database indexes, pods, or every cloud service.
For a cybersecurity platform, the same restraint matters. A diagram overloaded with security-product jargon often conceals the actual data paths that need review.
The notation contract: make the diagram stand alone
A reviewer should be able to read your diagram without listening to a five-minute explanation from its author. That requires consistent element types, short responsibility descriptions, explicit technology choices, directional relationship labels, and a legend.
Read the C4 model’s “Notation” guidance. It is a concise standard for making diagrams understandable outside the meeting in which they were created.
In the “Elements” subsection, begin a few sentences before the technology requirement and read through the end of that subsection. Then read the full “Relationships” subsection, paying particular attention to relationship direction, meaningful labels, and protocol annotations. Finish with “Diagram key/legend”; use it as a checklist for the diagram you construct below.
Apply these conventions to this course’s diagrams:
| Diagram element | What to include | Example |
|---|---|---|
| Container name | A stable responsibility-oriented name | Telemetry Connector |
| Type | Explicitly identify it as a container, person, or software system | Container: Rust background worker |
| Description | One short statement of responsibility | “Collects, validates, and normalizes tenant audit events.” |
| Technology | Primary implementation or storage technology | Rust/Tokio, PostgreSQL, Kafka-compatible event log |
| Relationship label | An action and meaningful data exchanged | “Publishes validated normalized events” |
| Protocol | The relevant runtime mechanism | HTTPS, OIDC, PostgreSQL/TLS, Kafka TLS/SASL |
A relationship should read naturally from source to destination. For example:
The Telemetry Connector publishes validated normalized events to the Durable Event Log using Kafka TLS/SASL.
That is much more useful than “Connector uses Kafka.”
What belongs outside this diagram
Do not place the following on this container diagram unless one has become a separately operated runtime system that materially changes the story:
- Rust modules, crates, traits, handlers, or middleware;
- individual API endpoints;
- database schemas, tables, row-level-security policies, or indexes;
- Kafka topics, consumer groups, offsets, or dead-letter policies;
- Kubernetes pods, namespaces, node pools, virtual networks, or IAM roles;
- cryptographic primitives and individual firewall rules;
- CI/CD pipelines and infrastructure-provisioning workflows.
Those details will matter later. They are simply different views: component diagrams, data-flow diagrams, deployment diagrams, and implementation documentation.
Derive containers from responsibilities, failure boundaries, and data ownership
The context diagram identified the platform’s external relationships. The next step is not to invent a microservice for every noun in the product brief. Instead, identify responsibilities that need separate lifecycle, scaling, failure isolation, or data-management treatment.
For the behavioral-detection pilot, the important forces are:
- Tenant-facing investigation: analysts and administrators need a controlled, tenant-scoped interface.
- External telemetry collection: Entra integration has source-specific credentials, rate limits, failure modes, and health status.
- Asynchronous detection: event receipt must not wait for impossible-travel evaluation.
- Recovery: a worker outage should not silently discard accepted telemetry.
- Evidence and case data: analysts need alert summaries and supporting event evidence.
- Federated workforce identity: the platform trusts an external identity issuer but must still validate tokens and enforce its own authorization decisions.
A coherent pilot decomposition is below.
| Container | Responsibility | Technology | Why it is separate |
|---|---|---|---|
| Web Console | Lets tenant administrators configure sources and lets SOC analysts investigate and close alerts. | TypeScript single-page application | Browser-facing user experience evolves independently of backend processing. |
| Investigation and Control API | Validates access tokens, applies tenant-aware authorization, serves alert and configuration workflows, and records privileged actions. | Rust, Axum, JSON over HTTPS | It is the primary policy-enforcement point for tenant-facing API requests. |
| Telemetry Connector | Collects tenant-scoped Entra sign-in events, validates and normalizes them, records source health, and publishes accepted events. | Rust, Tokio background worker | Integration behavior, credentials, source throttling, and retry logic should not be coupled to analyst requests. |
| Durable Event Log | Buffers normalized security events durably between ingestion and detection. | Kafka-compatible event log | It decouples ingestion availability from detection throughput and enables replay after worker failure. |
| Detection Worker | Consumes normalized events, maintains the state needed for impossible-travel evaluation, and creates alert summaries. | Rust, Tokio background worker | It scales and fails independently from the API and connector. |
| Investigation Store | Stores tenant configuration, connector cursors and health, detection state, alert summaries, cases, and disposition history. | PostgreSQL | These records require transactional updates and are queried by the investigation workflow. |
| Evidence Archive | Retains source records and normalized event evidence subject to tenant-scoped access and retention controls. | S3-compatible object storage | Evidence can grow much faster than operational case data and has a different storage and lifecycle profile. |
This is not a claim that seven deployables are always the correct production architecture. It is a reviewable baseline for the current pilot. In an early implementation, the Connector and Detection Worker could run from one Rust workspace or even one deployable process, while still being represented separately if their operational responsibilities are intentionally distinct. If that decision is temporary, document it as such.
Security implications should be visible in responsibilities
A secure diagram does not become secure by adding padlock icons. Instead, responsibilities should expose where security-relevant behavior occurs.
- The Web Console is an untrusted browser execution environment. It presents user workflows; it does not establish tenant authorization merely because a user signed in.
- The Investigation and Control API validates security-relevant token claims and makes authorization decisions for tenant-scoped data access. It must propagate tenant context deliberately to every downstream query and object lookup.
- The Telemetry Connector treats source data as untrusted input even when it arrives from an authenticated tenant integration. It must handle malformed, duplicated, delayed, and unexpectedly high-volume events.
- The Durable Event Log is a resilience boundary, not an authorization boundary. Access controls and encrypted transport still matter.
- The Detection Worker must make alert creation safe under retries and restarts; later lessons will formalize idempotency and processing semantics.
- The Investigation Store and Evidence Archive must prevent cross-tenant retrieval. The exact PostgreSQL isolation pattern and object-access policy are deliberate future design decisions, not details to hide.
A useful rule is:
If a container receives data, makes an access decision, persists tenant data, or crosses into a different trust domain, its description should make that responsibility apparent.
Construct the pilot container diagram
The following diagram specification makes one explicit integration decision: the platform collects Microsoft Entra ID sign-in records through its connector, rather than accepting inbound delivery. This is a valid current design choice, not an unavoidable fact of the product. If discovery later establishes that push delivery is preferable, the relationship and connector behavior should change accordingly.
The corporate identity service and Microsoft Entra ID remain external because they were external in the context diagram. The platform depends on them but does not own their implementation. The storage and event-log containers are inside the platform boundary because they are part of the runtime capability the platform must operate and secure, even if implemented with managed cloud services.
Relationship inventory
Before drawing, define the meaningful runtime relationships. This keeps the visual diagram from becoming a collection of unlabeled lines.
| Source | Destination | Relationship label and protocol | Architectural significance |
|---|---|---|---|
| SOC analyst or tenant administrator | Web Console | Investigates alerts or configures source access, HTTPS | Keeps user interaction on the browser-facing container. |
| Web Console | Corporate Identity Service | Authenticates workforce user, OIDC | Makes the federation boundary visible. |
| Web Console | Investigation and Control API | Reads tenant alerts and records dispositions, HTTPS/JSON | The API receives client-controlled requests and bearer tokens. |
| Investigation and Control API | Corporate Identity Service | Obtains issuer signing metadata, HTTPS | Token trust is grounded in an external issuer. |
| Investigation and Control API | Investigation Store | Reads and writes configuration, cases, and audit records, PostgreSQL/TLS | Tenant authorization must constrain these queries. |
| Investigation and Control API | Evidence Archive | Retrieves authorized investigation evidence, HTTPS | Object retrieval must remain tenant-scoped. |
| Telemetry Connector | Microsoft Entra ID | Collects tenant sign-in audit events, HTTPS/Microsoft Graph | Exposes the source dependency and collection mechanism. |
| Telemetry Connector | Durable Event Log | Publishes validated normalized events, Kafka TLS/SASL | Separates event acceptance from detection. |
| Telemetry Connector | Investigation Store | Reads connector configuration and records health cursor, PostgreSQL/TLS | Supports health monitoring and restart continuity. |
| Telemetry Connector | Evidence Archive | Archives source event evidence, HTTPS | Preserves investigation material separately from operational state. |
| Detection Worker | Durable Event Log | Consumes normalized events, Kafka TLS/SASL | Makes asynchronous processing explicit. |
| Detection Worker | Investigation Store | Maintains detection state and writes alert summaries, PostgreSQL/TLS | Connects detection decisions to analyst-visible state. |
| Platform operator | Web Console | Views connector health and operational status, HTTPS | Treats operational access as a distinct privileged workflow. |
The table does not replace a diagram. It is the diagram’s semantic contract: every line in the rendered view should correspond to a relationship worth reviewing.
Diagram-as-code baseline
For a principal-level architecture artifact, keep the source under version control with the architecture brief. Structurizr DSL is one practical option because it separates the architecture model from its rendered views.
Read the Structurizr tutorial’s sections on defining containers and rendering a container view. The goal is not to memorize the DSL; it is to see how a version-controlled model can generate consistent context and container diagrams.
In “2. Containers,” read the container declaration example, including the two code samples that define a container view. Then read “4. View expressions” and inspect the include examples. Notice how a container view retains relevant external people and systems while keeping the system under design as its scope.
Here is a compact starting model for the pilot. It deliberately shows containers and their runtime relationships, rather than attempting to encode future implementation detail.
workspace "Tenant Behavioral Detection Platform" "C4 container model for the pilot" {
    !identifiers hierarchical

    model {
        analyst = person "SOC Analyst" "Investigates tenant-scoped behavioral alerts."
        administrator = person "Tenant Administrator" "Configures tenant telemetry access."
        operator = person "Platform Operator" "Monitors integration health and incident state."

        identity = softwareSystem "Corporate Identity Service" "External workforce identity provider."
        entra = softwareSystem "Microsoft Entra ID" "External tenant sign-in audit source."

        platform = softwareSystem "Tenant Behavioral Detection Platform" {
            console = container "Web Console" "Provides tenant administration, investigation, and operational views." "TypeScript SPA"

            api = container "Investigation and Control API" "Validates tokens, enforces tenant-aware authorization, and serves configuration and investigation workflows." "Rust/Axum"

            connector = container "Telemetry Connector" "Collects, validates, and normalizes tenant sign-in events; records integration health." "Rust/Tokio worker"

            eventLog = container "Durable Event Log" "Durably buffers normalized security events between ingestion and detection." "Kafka-compatible event log"

            detector = container "Detection Worker" "Evaluates impossible-travel behavior and creates alert summaries." "Rust/Tokio worker"

            store = container "Investigation Store" "Stores tenant configuration, connector cursors, detection state, alerts, cases, and audit records." "PostgreSQL"

            evidence = container "Evidence Archive" "Retains source records and normalized evidence under retention controls." "S3-compatible object storage"
        }

        analyst -> platform.console "Investigates tenant alerts" "HTTPS"
        administrator -> platform.console "Configures source access" "HTTPS"
        operator -> platform.console "Views integration health" "HTTPS"

        platform.console -> identity "Authenticates workforce user" "OIDC"
        platform.console -> platform.api "Reads alerts and records dispositions" "HTTPS/JSON"

        platform.api -> identity "Obtains issuer signing metadata" "HTTPS"
        platform.api -> platform.store "Reads and writes cases, configuration, and audit records" "PostgreSQL/TLS"
        platform.api -> platform.evidence "Retrieves authorized evidence" "HTTPS"

        platform.connector -> entra "Collects tenant sign-in audit events" "HTTPS/Microsoft Graph"
        platform.connector -> platform.eventLog "Publishes validated normalized events" "Kafka TLS/SASL"
        platform.connector -> platform.store "Reads configuration and records source-health cursor" "PostgreSQL/TLS"
        platform.connector -> platform.evidence "Archives source event evidence" "HTTPS"

        platform.detector -> platform.eventLog "Consumes normalized events" "Kafka TLS/SASL"
        platform.detector -> platform.store "Maintains detection state and writes alert summaries" "PostgreSQL/TLS"
    }

    views {
        container platform "secure-backend-containers" {
            include *
            autolayout tb
        }
    }
}
When rendered, add a legend with at least these meanings:
- System boundary: the Tenant Behavioral Detection Platform.
- Internal boxes: C4 containers operated as part of the platform capability.
- External boxes: people or software systems outside the platform boundary.
- Directed lines: runtime dependency or primary data-flow direction.
- Technology annotations: primary implementation, data-store, or protocol choice.
Do not use color as the only way to distinguish trust or container type. A diagram should still be understandable when printed in grayscale or viewed by someone unfamiliar with its original tool.
Review the diagram against the quality scenarios
A container diagram is useful when it can be challenged against explicit requirements. For the pilot, use the quality scenarios established earlier to test whether the decomposition has a reason to exist.
| Quality concern | Containers involved | What the diagram should make reviewable |
|---|---|---|
| Tenant isolation | Web Console, API, Investigation Store, Evidence Archive | The browser is not trusted to enforce tenant scope; the API is the authorization point, and all persistence paths carry tenant-scoped data. |
| Timely detection | Connector, Durable Event Log, Detection Worker | Ingestion and scoring are decoupled, allowing workers to scale or recover independently. |
| Recovery from processing failure | Durable Event Log, Detection Worker, Investigation Store | Accepted events can remain available for reprocessing, while state and alert records survive worker restarts. |
| Silent telemetry source | Connector, Investigation Store, Web Console | The connector records health and cursor state, and an operational user can observe source health through an explicit path. |
| Federated workforce access | Web Console, API, Corporate Identity Service | Authentication depends on the identity service, but platform authorization remains inside the platform boundary. |
The diagram does not prove these properties. For example, showing PostgreSQL does not prove row-level tenant isolation, and showing a Kafka-compatible event log does not prove exactly-once alert creation. It does, however, identify the containers where the proof obligations belong.
Assumptions to record next to the diagram
A polished diagram should not hide unresolved decisions. Record these as assumptions or open decisions:
- Telemetry collection: The pilot pulls sign-in events from Microsoft Entra ID using Microsoft Graph. Confirm tenant permissions, rate limits, pagination, and collection latency.
- Event processing: The event log provides the durability and replay behavior required for the pilot. Delivery semantics, partitioning, and idempotent processing remain to be specified.
- Tenant storage model: The initial Investigation Store is shared PostgreSQL. The exact isolation mechanism, including database roles and possible row-level security, remains a security-design decision.
- Evidence retention: The retention period, deletion obligations, and access model for evidence have not yet been fixed.
- Operational access: Platform operators can inspect source health without unrestricted access to tenant evidence. The precise privileged-access workflow remains to be designed.
- Secret handling: Connector and data-store credentials are not represented as a secret-store container in this view. If an external secret-management system becomes a material runtime dependency, add it as an external system and show its relationship to the affected containers.
Studio workflow: produce your version
Use the baseline model as a starting point, not an answer to copy mechanically.
- Create a diagram source file in the same repository as the pilot architecture brief.
- Render a container view with the system boundary, the seven internal containers, the three human roles, and the two external systems.
- Add the responsibility and technology text to every internal container.
- Ensure every relationship has one direction, an action-oriented label, and a protocol where containers communicate.
- Put the six assumptions beside the diagram or in a linked decision log.
- Conduct a short review by reading every relationship aloud as a sentence. If a sentence sounds vague, replace labels such as “uses,” “connects,” or “integrates with” with the actual action and data involved.
- Remove anything that belongs to a component, deployment, or data-flow diagram rather than a container view.
A final principal-level check is to ask whether a new engineer could identify the platform’s main data-bearing containers, external trust dependencies, and operational failure boundaries in under two minutes. If not, simplify the visual layout or sharpen the descriptions before adding more detail.
Key takeaways
A C4 container diagram decomposes the context-level system into its major applications, workers, data stores, and runtime relationships. It is not a Docker diagram, class diagram, deployment diagram, or threat-model DFD.
For the behavioral-detection pilot, a useful baseline includes:
- a browser-based Web Console;
- a Rust Investigation and Control API;
- a Rust Telemetry Connector;
- a durable event log;
- a Rust Detection Worker;
- PostgreSQL for operational and investigation state;
- object storage for retained evidence.
The essential design narrative is that tenant-facing authorization lives at the API boundary, source-specific ingestion is isolated in a connector, durable buffering separates ingestion from detection, and case data and evidence have distinct storage responsibilities.
Next, you will quantify this design by estimating peak throughput, storage growth, and bandwidth from stated workload assumptions. That capacity model will test whether the container responsibilities and technology choices remain plausible under normal operation and attack traffic.
Can't find a good explanation? Sign up and we'll make it for you
Sign up