
Hello! Welcome to your next lesson in our study of clinical diagnostics.
In our last session, we delved into spirometry, learning how we measure the mechanical function of the lungs—the volumes and flow rates of air. Today, we'll explore the physiological outcome of that function by answering the question: "How effectively is oxygen getting into the blood?"
This lesson is dedicated to the learning outcome: Describe the working principle of a pulse oximeter for measuring blood oxygen saturation (SpO2).
The pulse oximeter is a cornerstone of modern medical monitoring, found in everything from intensive care units to consumer fitness trackers. Understanding its principles is fundamental, and it connects directly to your work at Neuraease. The same optical techniques used for oxygen measurement, known as photoplethysmography (PPG), are the basis for heart rate and heart rate variability (HRV) sensing in most wearables.
Let's begin by looking at the device and the basic concept.

1. The Biological Variable: Oxygenated vs. Deoxygenated Blood
The goal of a pulse oximeter is to non-invasively measure the percentage of oxygenated hemoglobin in arterial blood. This is known as SpO2 (peripheral oxygen saturation).
The key lies in the protein hemoglobin (Hb) within our red blood cells. When hemoglobin in the lungs binds with oxygen, it becomes oxyhemoglobin (HbO2). As it circulates and delivers oxygen to tissues, it reverts to deoxyhemoglobin (Hb).
Critically, these two forms of hemoglobin have different optical properties—they absorb different amounts of light at specific wavelengths.
To see a great introduction to the concepts of pulse oximetry, let's watch a short video.
This video from The Alfred Intensive Care Academic Centre provides an excellent overview of the four key components of a pulse oximetry system and introduces the principle of differential light absorption.
Watch the first 1 minute and 45 seconds of the video (00:00 - 01:45). Focus on understanding: The biological variable being measured (hemoglobin saturation). The core principle that HbO2 and Hb have different light absorption characteristics.
The Absorption Spectra
The video mentioned that oxygenated blood is bright red, and deoxygenated blood is dark red. This visual difference is the basis of pulse oximetry and can be precisely described by an absorption spectrum graph.
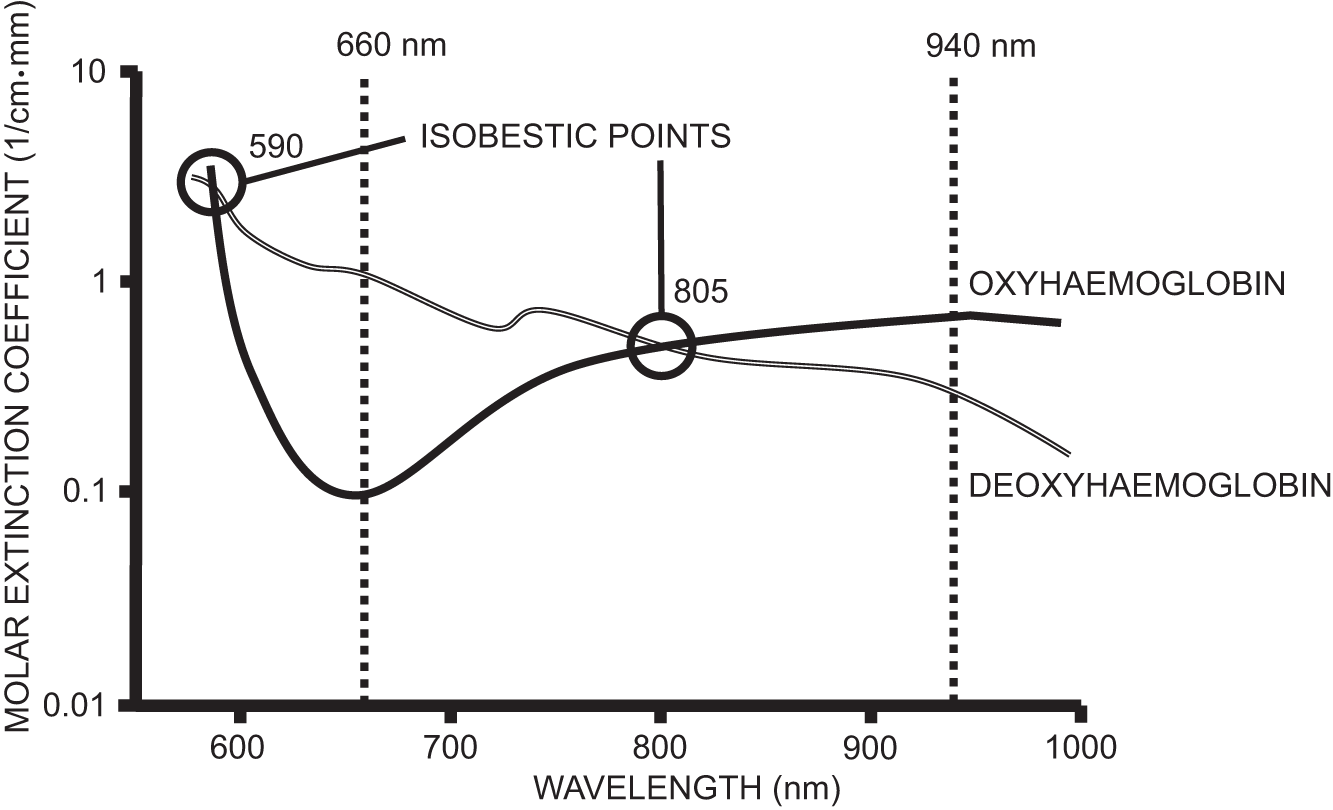
Look closely at the two wavelengths marked by the vertical dashed lines:
- Red Light (660 nm): At this wavelength, deoxyhemoglobin (Hb, thin line) absorbs significantly more light than oxyhemoglobin (HbO2, thick line).
- Infrared Light (940 nm): At this wavelength, the situation is reversed. Oxyhemoglobin (HbO2) absorbs more light than deoxyhemoglobin (Hb).
A pulse oximeter exploits this difference by shining both red and infrared light through your fingertip and measuring how much of each gets through to the other side.
2. The Measurement Principle: Beer-Lambert Law and the Pulsatile Signal
So, how do we get from measuring light absorption to calculating an SpO2 percentage? The process involves two key steps: applying a physical law and isolating the correct signal.
The Beer-Lambert Law
The physical principle at play is the Beer-Lambert Law. In simple terms, it states that the amount of light absorbed by a substance is proportional to its concentration. Given your ECE background, you can think of this as analogous to signal attenuation—the more "stuff" in the path, the weaker the signal gets on the other side.
The law is formally written as:
where:
- is the absorbance (what we measure).
- (epsilon) is the extinction coefficient (an intrinsic property of the substance at a specific wavelength, visible in the graph above).
- is the path length the light travels.
- is the concentration of the substance.
If we knew the path length () and the extinction coefficients (), we could directly calculate the concentration of HbO2 and Hb. But a finger isn't a simple lab sample; it contains skin, bone, muscle, and both venous and arterial blood. This makes and complex and variable.
Isolating the Arterial Signal
This is where the "pulse" in "pulse oximeter" becomes critical. With each heartbeat, a pulse of arterial blood flows into your fingertip, causing it to swell slightly. This means the total volume of arterial blood—and thus the light path through it—changes rhythmically. In contrast, the light absorption by static tissues (skin, bone, venous blood) remains relatively constant.
From a signal processing perspective, the light signal received by the photodetector has two main components:
- DC Component: A large, constant (or slowly varying) signal corresponding to the absorption by static tissues and non-pulsatile blood.
- AC Component: A small, pulsatile signal riding on top of the DC component, caused by the changing volume of arterial blood with each heartbeat.
The AC component is the signal of interest because it represents the absorption characteristics of arterial blood only.
To understand this concept and the subsequent calculations in more detail, we'll turn to a more technical resource.
Pulse oximetry – understanding the device and the sources of error
The article 'Pulse oximetry – understanding the device and the sources of error' provides a rigorous explanation of the signal processing steps. We'll focus on how the AC and DC components are used.
Please read the sections titled 'Step 1: Spectroscopy' and 'Step 2: Isolation of the arterial absorbance'. Focus on Figure 2, which visually represents the AC and DC components. Understand how the device leverages the pulsatile nature of arterial blood to isolate the signal it needs from the background noise of other tissues.
3. Calculating SpO2: The "Ratio of Ratios" and the Calibration Curve
By isolating the AC component, we've solved half the problem. But we still need a robust way to calculate SpO2 that isn't thrown off by things like finger thickness or probe pressure.
The solution is to calculate a "ratio of ratios," often called the R-value. This is the core calculation performed by the oximeter's microprocessor.
The device calculates the AC/DC ratio for both the red and the infrared signals. It then computes the ratio of these two values:
This normalization is a clever engineering trick. By dividing AC by DC for each wavelength, the measurement becomes independent of the incident light intensity and the total tissue path length, making the reading much more stable and reliable.
Test your understanding!
Imagine a person's blood oxygen level drops (desaturation). This means the concentration of deoxyhemoglobin (Hb) increases, and oxyhemoglobin (HbO2) decreases.
Based on the absorption graph, what would happen to:
- The AC component of the red light signal?
- The AC component of the infrared light signal?
- The overall R-value?
Show answer
- Red Light (660 nm): Deoxyhemoglobin (Hb) absorbs much more red light than oxyhemoglobin (HbO2). As Hb increases, the pulsatile absorption of red light will increase significantly. The red AC component gets larger.
- Infrared Light (940 nm): Oxyhemoglobin (HbO2) absorbs slightly more IR light than deoxyhemoglobin (Hb). As HbO2 decreases and Hb increases, the overall pulsatile absorption of IR light will decrease slightly. The infrared AC component gets smaller.
- R-value: Since the numerator () increases and the denominator () decreases, the R-value will increase. A higher R-value corresponds to a lower SpO2.
The Calibration Curve
You might think we could now use the Beer-Lambert law to convert R directly into an SpO2 value. However, the real-world physics of light scattering in human tissue is more complex than the simple law assumes. The effective path length () is not identical for red and infrared light.
To solve this, manufacturers use an empirical calibration curve.
Pulse oximetry – understanding the device and the sources of error
Let's return to the same article to understand this final, crucial step.
Please read the sections 'Step 3: Comparison of the arterial absorbance at the two wavelengths' and 'Step 4: Correlation of R to an SpO2 value'. Pay close attention to Figure 3, the calibration curve. Understand why this empirical method is more accurate than a direct calculation and how it's created (using volunteers). Also, quickly read the section starting with 'So, of all the wavelengths of light that could have been used...' to solidify why 660 nm and 940 nm are chosen.
This calibration curve is a lookup table programmed into the oximeter. The device measures R and then uses the curve to find the corresponding SpO2 value. This is why accuracy is typically quoted down to about 70-75% SpO2—for ethical reasons, the calibration data from volunteers doesn't go lower, and the rest of the curve is extrapolated.
4. Practical Engineering and Implementation
Let's briefly touch on the hardware and software that brings this all together, connecting the theory to the kind of components you're familiar with.
A low-cost pulse oximeter can be built with a few key parts:
- Light Emitters: A red LED (660 nm) and an IR LED (940 nm).
- Light Detector: A single photodiode sensitive to both wavelengths.
- Signal Conditioning: A transimpedance amplifier (TIA) to convert the photodiode's current output to a voltage, followed by filters and another gain stage.
- Control & Processing: A microcontroller or Digital Signal Controller (DSC) to manage the entire process.
The controller rapidly switches the LEDs on and off in sequence: Red ON -> IR ON -> Both OFF.
- Red ON: ADC measures the red light level.
- IR ON: ADC measures the infrared light level.
- Both OFF: ADC measures the ambient light level, which can then be subtracted from the other readings to prevent interference from room lighting.
This rapid switching (hundreds of times per second) allows a single photodetector to measure both wavelengths and correct for ambient light. The controller then processes the stream of ADC values to separate the AC and DC components, calculate R, and look up the SpO2 value.
For a deeper dive into a practical design, including circuit diagrams and code structure, the Digi-Key article "Low-Cost Pulse Oximeter Design" (resource LINK) is an excellent reference for someone with your background.
Finally, it's worth noting the difference between transmissive oximetry (like a finger clip, where light passes through tissue) and reflective oximetry (where the emitter and detector are side-by-side, common in smartwatches). While the sensing location is different, the core principles of using red/IR light and isolating the pulsatile signal remain the same.
Conclusion
In this lesson, we have dissected the working principle of the pulse oximeter, a device that elegantly combines physiology, physics, and signal processing.
Key Takeaways:
- Pulse oximetry measures SpO2 by exploiting the different light absorption properties of oxyhemoglobin (HbO2) and deoxyhemoglobin (Hb) at red (660 nm) and infrared (940 nm) wavelengths.
- The system isolates the pulsatile (AC) component of the light signal, which corresponds to arterial blood, from the static (DC) component from other tissues.
- A normalized R-value is calculated from the AC/DC ratios of both wavelengths to create a stable measurement.
- This R-value is converted to an SpO2 percentage using an empirical calibration curve derived from human studies.
Preview of the Next Lesson:
We've just seen how to measure blood oxygenation non-invasively using optics. In our next lesson, we will shift to another category of sensors: biochemical sensors. We will explore how these devices directly measure the chemical properties of blood, such as pH and the partial pressures of oxygen (pO2) and carbon dioxide (pCO2), giving us a more direct, though often invasive, assessment of a patient's metabolic state.
Can't find a good explanation? Sign up and we'll make it for you
Sign up