
Hello! Welcome back to our module on "Leveraging Predictive Analytics for Performance."
In our last lesson, we explored how to interpret the outputs of predictive models, like the churn probability scores they assign to each customer. This raises a crucial question for any marketing leader: "The model gave me a score, but is the model any good? Can I trust it enough to allocate my budget based on its predictions?"
Today, we'll answer that question directly. Our focus is on how to evaluate a model's business value by interpreting performance metrics like precision, recall, and AUC. You'll learn not just what these metrics are, but more importantly, what they mean for your strategy and bottom line. This will equip you to have more incisive conversations with your analytics team and make more confident, data-informed decisions.
1. The Foundation: Understanding a Model's Predictions with the Confusion Matrix
Before we can evaluate a model, we need a simple way to categorize its predictions as either correct or incorrect. For a binary classification model (e.g., predicts Churn or No Churn), there are four possible outcomes when we compare the model's prediction to the actual reality. These are organized in what's called a confusion matrix.
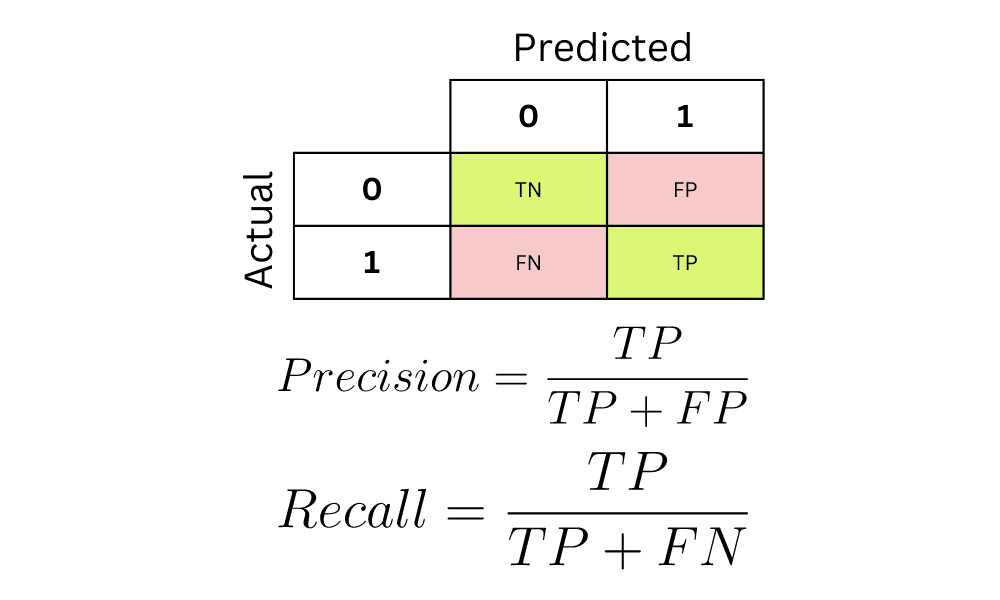
Let's break this down in the context of a churn model:
- True Positive (TP): The model correctly predicts a customer will churn, and they actually do.
- Business Impact: A win! You identified an at-risk customer and now have an opportunity to save them.
- True Negative (TN): The model correctly predicts a customer will not churn, and they stay.
- Business Impact: Also a win. You correctly avoided spending retention marketing budget on a happy customer.
- False Positive (FP): The model incorrectly predicts a customer will churn, but they were actually happy and would have stayed.
- Business Impact: A cost. You might waste money on an unnecessary discount or annoy a loyal customer with an irrelevant "we miss you" message. This is a Type I error.
- False Negative (FN): The model incorrectly predicts a customer will stay, but they actually churn.
- Business Impact: A significant loss. You missed the chance to save a customer, resulting in lost revenue. This is a Type II error.
As a leader, your main concern is the business impact of the two error types: False Positives and False Negatives. The metrics we discuss next are designed to help you measure and balance the costs of these two specific errors.
2. The Core Business Trade-off: Precision vs. Recall
Most model evaluation metrics are derived from the four values in the confusion matrix. Two of the most important are Precision and Recall. They are often in tension with each other, and understanding their trade-off is critical for strategic decision-making.
To get an intuitive, business-focused grasp of this concept, let's watch a video from Cassie Kozyrkov, Chief Decision Scientist at Google.
MFML 044 - Precision vs recall
In this video, 'Precision vs recall,' Cassie uses brilliant, simple analogies to explain the difference between precision and recall and, crucially, when a business should care more about one than the other.
Please watch from 01:14 to 05:40. Focus on: The clear definitions of Precision and Recall. The 'book recommender' vs. 'robbing a house' analogy. This is key to understanding the business trade-off.
Let's summarize and apply this to our marketing context:
-
Precision: Answers the question, "Of all the customers we flagged as churners, how many actually were?"
- Formula:
- When to Prioritize Precision: When the cost of a False Positive is high. For example, if your retention strategy involves giving a very expensive gift, you want to be very precise and not give it to loyal customers who weren't going to leave anyway. High precision minimizes wasted effort.
-
Recall (or Sensitivity): Answers the question, "Of all the customers who truly churned, how many did our model catch?"
- Formula:
- When to Prioritize Recall: When the cost of a False Negative is high. For example, if you're a B2B company and losing one enterprise client could cost millions, you want to cast a wide net and catch every potential churner, even if it means you accidentally contact a few happy clients. High recall minimizes missed opportunities.
This trade-off is often visualized with a Precision-Recall Curve, showing that as you increase recall, you often decrease precision, and vice-versa.

Test your understanding!
Imagine you're launching a marketing campaign for a new, affordable subscription service. Your goal is to send a "first month free" offer to a list of potential customers identified by a predictive model as "likely to subscribe." The offer is very cheap to fulfill. To maximize campaign sign-ups, should your data science team optimize the model for higher precision or higher recall?
Show answer
You should prioritize higher recall.
The cost of a False Positive (sending a cheap offer to someone who wasn't going to subscribe anyway) is very low. However, the cost of a False Negative (failing to identify a potential subscriber and thus missing out on a new customer) is a significant lost opportunity. In this scenario, you want to capture as many potential subscribers as possible, even if it means sending the offer to some people who won't convert.
3. A Holistic View: The ROC Curve and AUC
Precision and recall are calculated at a single prediction threshold. For instance, you might classify anyone with a churn probability > 0.7 as Churn. But if you lower that threshold to 0.5, your recall will go up (you'll catch more churners), but your precision will likely go down (you'll misclassify more loyal customers).
So how do you evaluate the model across all possible thresholds? This is where the Receiver Operating Characteristic (ROC) curve and the Area Under the Curve (AUC) come in.
This concept is explained exceptionally well in the following video.
ROC and AUC, Clearly Explained!
This video, 'ROC and AUC, Clearly Explained!' from StatQuest, is one of the best resources for understanding these concepts. It visually builds the ROC curve from scratch and makes the idea of AUC very intuitive.
Please watch from 02:03 to 14:31. The video is a bit long but foundational. Focus on grasping: How changing the classification threshold changes the model's errors. What the two axes of the ROC curve—True Positive Rate (Recall) and False Positive Rate—represent. What the final AUC number signifies about the model's overall performance.
Here are the key takeaways for you as a leader:
- ROC Curve: This plots the True Positive Rate (Recall) against the False Positive Rate at every possible threshold. A model curve that is further to the top-left is better, as it achieves a high TP rate with a low FP rate.
- AUC (Area Under the Curve): This is a single number from 0 to 1 that summarizes the entire ROC curve. It represents the model's ability to distinguish between the positive and negative classes.
- AUC = 1.0: A perfect model.
- AUC = 0.5: A useless model, no better than a random coin flip.
- AUC > 0.7: Generally considered an acceptable model.
- AUC > 0.8: Generally considered a good model.
- AUC > 0.9: Generally considered an excellent model.
The primary value of AUC for you is as a standardized metric for comparing different models. If your team says "Model A has an AUC of 0.88 and Model B has an AUC of 0.81," you immediately know that Model A is generally better at distinguishing churners from non-churners.
4. The Bottom Line: Translating Metrics into Dollars
While AUC, precision, and recall are essential for your analytics team, you ultimately need to answer to the CFO. The most powerful way to evaluate a model is to translate its performance into financial impact. The Expected Value (EV) framework does exactly this.
This framework assigns a dollar value to each quadrant of the confusion matrix and calculates the average profit (or cost) per customer when using the model.
Turning Data to Dollars: Translating ML Metrics into Business ...
This article, 'Turning Data to Dollars,' provides a practical, step-by-step walkthrough of applying the Expected Value framework to a churn model. It's the perfect bridge from statistical metrics to business ROI.
Please read the article from the beginning through the 'Conclusion.' Focus on understanding the logic of assigning a monetary value to each outcome (TP, FP, FN, TN) and how they combine to produce an 'expected profit per customer.' You can skim the detailed probability calculations and focus on the business setup and the final result.
The logic is powerful because it forces a clear business conversation:
- Value of a True Positive (TP): What is the net profit from retaining a customer we would have otherwise lost? (e.g.,
$30) - Cost of a False Positive (FP): What does it cost to send our retention offer? (e.g.,
-$10for the discount) - Cost of a False Negative (FN): What is the profit we lose when a customer churns? (In the article's example, this is
$0because the customer was lost anyway, but in other frameworks, this is an opportunity cost representing lost LTV). - Value of a True Negative (TN):
$0, as no action was taken and the outcome was correct.
By combining these costs/benefits with the probabilities of each outcome (which come from the model's performance), you can calculate a single dollar figure. In the article's example, it's $2.20 expected profit per customer. This is a metric that allows you to build a powerful business case, directly connecting the data science work to financial results.
Conclusion
Today we've demystified the process of evaluating predictive models. You've moved beyond simply seeing a model's output to critically assessing its quality and, most importantly, its business value.
Key Takeaways:
- Errors Have Different Costs: The core of model evaluation is understanding the business cost of a False Positive (wasted effort) versus a False Negative (missed opportunity).
- Precision vs. Recall is a Strategic Choice: You must guide your team on whether to prioritize avoiding wasted effort (high precision) or capturing all opportunities (high recall), based on your specific business case.
- AUC is Your Go-To for Model Comparison: Use AUC as a high-level metric to determine which model is fundamentally better at telling your customers apart.
- Translate Metrics to Money: The ultimate evaluation is the Expected Value framework, which calculates the ROI of the model in dollars and cents—the language of the business.
Preview of the Next Lesson:
Now that you know how to interpret a model's output and evaluate if it's any good, the next logical step is to put it into action. Our next lesson, "Translate churn risk scores into a targeted retention strategy and campaign brief," will focus on the practical application. We'll take the outputs of a high-performing model and design a segmented, actionable marketing campaign, bridging the gap from analytics to execution.