
Hello! Welcome to the first lesson in our module on "Leveraging Predictive Analytics for Performance."
In our previous module, we concluded by focusing on a specific, powerful predictive model: Predicted Lifetime Value (pLTV). We discussed how you, as a leader, can oversee a strategy to shift acquisition spend from optimizing for immediate CPA to investing in customers with the highest future value.
Today, we'll broaden that perspective. While pLTV predicts value, many other models predict customer actions or states. This lesson will teach you how to interpret the outputs of these common models, specifically focusing on those that predict conversion probability and churn risk. This directly addresses our learning outcome: to interpret the outputs of common predictive models (e.g., conversion probability, churn risk).
Understanding these outputs is a core competency for a modern marketing leader. It allows you to grasp the insights from your analytics team, ask intelligent questions, and, most importantly, translate abstract probabilities into concrete business strategies.
1. From Prediction to Proaction: The Case of Churn Models
Let's begin with one of the most common and strategically vital predictive models in marketing: the churn model. A churn model's purpose is to identify customers who are likely to stop doing business with you.
Your background in leading a social media marketing team and managing ad campaigns has centered on acquisition and engagement. Churn prediction is the other side of that coin: retention. As we've discussed, retaining a customer is often far more cost-effective than acquiring a new one.
To get a clear, business-focused overview of churn models, please watch the following video.
What is Churn and how to build a Churn Model (Data Terms Explained)
This video, 'What is Churn and how to build a Churn Model' from Shorful, provides an excellent high-level explanation of what a churn model is and why it's so valuable for a business.
Please watch from the beginning until 06:30. As you watch, focus on the answers to these three strategic questions: What kind of business can use a churn model? Why is defining 'churn' itself a critical business decision? What is the primary business value of predicting churn early?
The video makes a crucial point: the goal of a churn model isn't just to know that a customer will leave. It's to predict it far enough in advance to give the business a window of opportunity to intervene. This proactive stance is what turns an analytical tool into a strategic asset for revenue protection.
To further solidify the business case for churn prediction, let's look at a quick reading.
Comprehensive Guide to Performing Churn Analysis
This section from the 'Comprehensive Guide to Performing Churn Analysis' by Mercity.ai articulates the strategic importance of churn prediction, framing it as a shift from a reactive to a preventive strategy.
Please read the sections 'What is Churn prediction?' and 'Why do companies need Churn Prediction?'. Pay attention to how it links churn prediction directly to profitability and resource optimization.
2. Interpreting the Language of Predictive Models
Now that we've established the strategic "why," let's dive into the "what." When your analytics team presents the results of a predictive model, what will you actually see? Different models speak different languages, and your job is to interpret them.
We'll explore a few common types, using churn prediction as our example. For a model predicting conversion, the interpretation would be analogous—just substitute "churn" with "convert."
Comprehensive Guide to Performing Churn Analysis
We'll return to the Mercity.ai article. This next section provides an excellent, non-technical overview of different types of models and, most importantly, what they output. Given your computer science background, you'll recognize the names of these models, but our focus here is purely on interpreting their business meaning.
Please read the 'Model Selection' section. For each model type (Logistic Regression, Decision Trees/Random Forests, Kaplan-Meier, Cox Proportional Hazards), focus on understanding the nature of its output—is it a probability, a set of rules, a survival curve, or a risk ratio?
Let's synthesize those concepts into a leader's guide to model outputs.
A. Classification Models (The "Who")
These models are the most common and answer the question: "Who is likely to churn?"
-
Logistic Regression:
- Output: A probability score for each customer, from 0 to 1 (e.g., Customer X has a 0.75 probability of churning next month).
- Interpretation: It also provides coefficients for each feature (e.g., every additional support ticket increases the log-odds of churn by 0.2). This helps you understand the drivers of churn. It's highly interpretable and great for explaining the "why" to stakeholders.
-
Random Forests / Gradient Boosting (e.g., XGBoost):
- Output: Also a probability score, often more accurate than logistic regression because they can capture complex, non-linear relationships.
- Interpretation: While these are more "black box," they can produce feature importance rankings. You might see a chart showing that
tenureandmonthly_chargesare the two most important predictors of churn. This tells you where to focus your strategic attention.
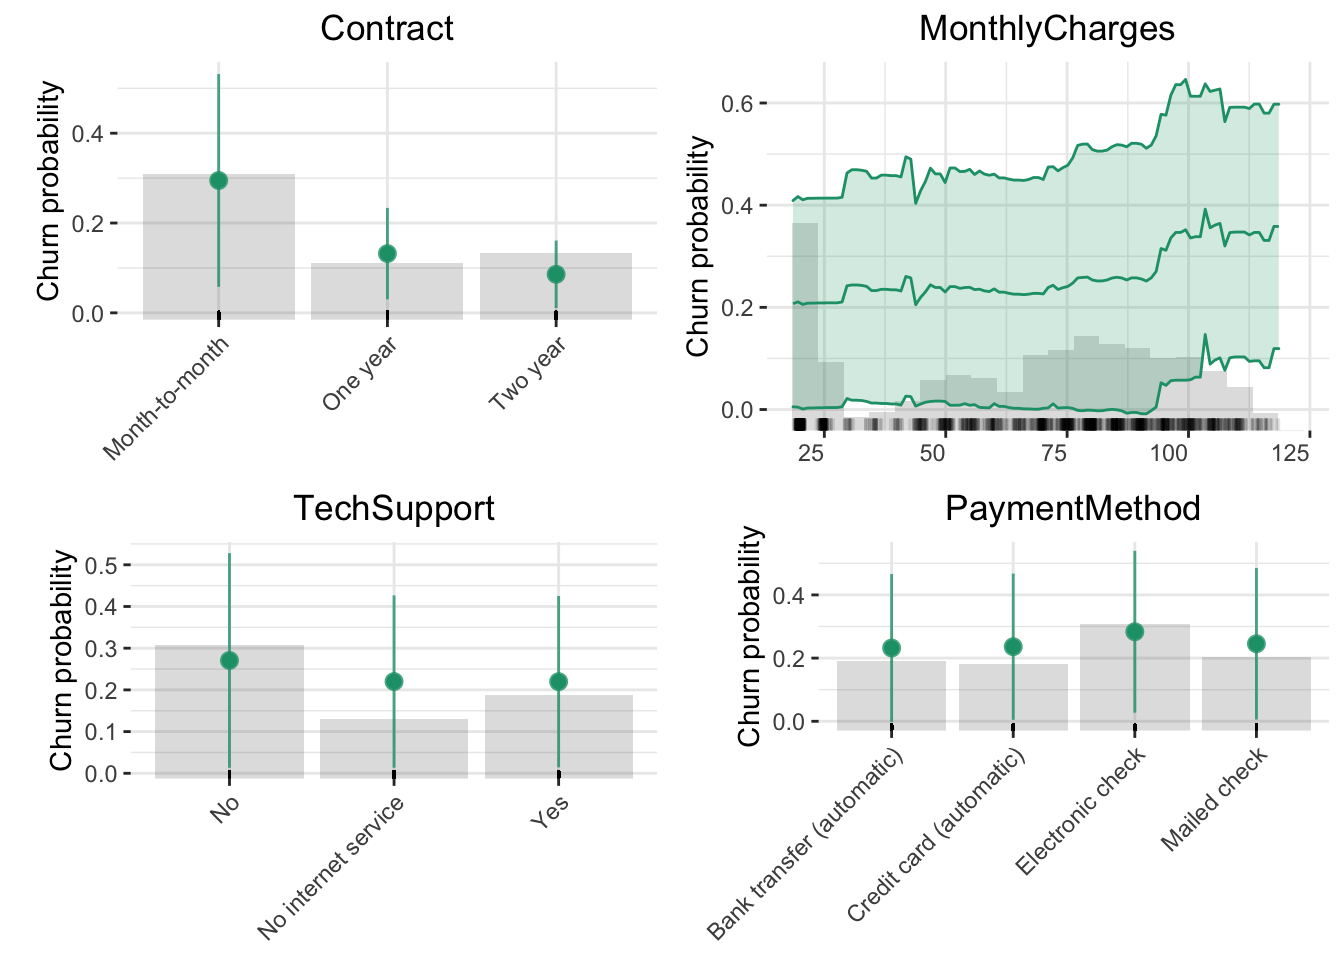
The image below shows a typical output of interpreting a model's findings. It visualizes how the probability of churn changes based on different customer attributes, which is an insight derived from a predictive model.
B. Survival Analysis Models (The "When")
These models answer a more nuanced question: "When are customers likely to churn?" This is often more powerful for strategic planning.
-
Kaplan-Meier Survival Analysis:
- Output: A survival curve. This curve plots the percentage of a customer cohort that is still "alive" (i.e., has not churned) over time.
- Interpretation: You can answer questions like, "What percentage of our new customers are still with us after 6 months?" or "Is there a steep drop-off point, say, after the 3rd month, where we should focus our retention efforts?"
-
Cox Proportional Hazards Model:
- Output: A set of hazard ratios.
- Interpretation: This is a very powerful output. A hazard ratio > 1 for a feature means it increases the risk of churn at any given point in time. For example, a hazard ratio of 1.5 for the feature
has_technical_support_issuemeans that customers with this issue have a 50% higher risk of churning at any moment compared to those who don't. This helps you prioritize which problems to solve first.
Test your understanding!
Your analytics team presents two findings from two different models:
- A Logistic Regression model gives "Monthly Contract" a high positive coefficient.
- A Kaplan-Meier analysis shows a steep drop in the survival curve between months 1 and 2.
How would you combine these two insights to propose a strategic action to the business?
Show answer
You could synthesize these findings into a clear, actionable recommendation:
"The data shows us two things. First, our customers on monthly contracts are at the highest risk of leaving. Second, the greatest risk period is right after their first month.
Therefore, I propose we create a targeted retention campaign specifically for customers on monthly contracts, to be deployed in their third and fourth week. The goal would be to demonstrate the long-term value of our service and potentially offer a small incentive to upgrade to an annual plan before they hit that critical one-month drop-off point."
This response correctly interprets both model outputs and translates them into a single, concrete business strategy.
3. From Interpretation to Action
The final and most important step is translating a model's output into a business decision. A list of customers with churn probabilities is data; a plan to retain them is a strategy.
The image below is a perfect example of this translation in action. It shows how raw data and a model's prediction can be organized into a dashboard that recommends a specific action.

This process of turning scores into actions is your primary role as a leader. Let's explore the types of actions you can drive.
Comprehensive Guide to Performing Churn Analysis
This final reading from the Mercity.ai article details how to use churn predictions for practical business and marketing optimization. It provides a menu of strategic options you can deploy based on model outputs.
Please read the section 'Using Churn Predictions for Business and Marketing Optimization.' Focus on the different categories of action you can take, such as targeted campaigns, feature engagement, and onboarding enhancements.
Here's a framework for action, based on the article:
- Segment by Risk: Divide customers into risk tiers (e.g., high, medium, low) based on their probability scores.
- High-Risk Segment:
- Action: Deploy your most effective (and potentially most expensive) retention offers. This could be a discount, a call from a customer success manager, or a special bonus.
- Goal: Immediate churn prevention.
- Medium-Risk Segment:
- Action: Use lower-cost, automated engagement tactics. This could be an email highlighting an underused feature, a tutorial, or a personalized content recommendation.
- Goal: Nudge them back towards engagement before they become high-risk.
- Low-Risk Segment:
- Action: Generally, no direct retention action is needed. You might focus on cross-selling or up-selling to this happy, engaged group.
- Goal: Deepen the relationship and increase LTV.
Your role is to guide the team to design these tiered strategies, set the probability thresholds for each tier, and measure the ROI of the retention efforts.
Conclusion
In this lesson, we moved from the specific application of pLTV to a broader understanding of how to interpret common predictive models. You've learned how to read the language of these models and, more importantly, how to translate their outputs into strategic business actions.
Key Takeaways:
- Models Answer Business Questions: Predictive models for churn or conversion aren't just technical exercises; they are tools to create a window of opportunity for proactive business intervention.
- Different Models, Different Outputs: You can interpret a model's insights by understanding its output—whether it's a simple probability score (from Logistic Regression), a feature importance list (from Random Forest), a survival curve (from Kaplan-Meier), or a set of hazard ratios (from a Cox model).
- Interpretation Drives Strategy: Understanding which features drive churn (e.g., contract type, high monthly bills) helps you identify the root causes to address in your product or marketing.
- From Score to Action: The ultimate goal is to use probability scores to segment customers into risk tiers and deploy tailored strategies for each, turning analytical insight into measurable business impact.
Preview of the Next Lesson:
Now that you can interpret what a model says, a critical follow-up question arises: "How good is this model? Should I trust its predictions?" Our next lesson, "Evaluate a model's business value by interpreting performance metrics (e.g., precision, recall, AUC)," will tackle this head-on. We'll explore the key metrics used to judge a model's performance, not just in a statistical sense, but in terms of its real-world business value.