
Good to see you again. In the previous lesson, you traced a hostname lookup through NSS, local resolver behavior, and upstream DNS. This lesson begins at the next boundary: you now have a specific destination IP address, but the application still cannot establish a TCP connection.
The goal is not to memorize a list of network commands. It is to construct a defensible conclusion from three kinds of evidence:
- socket evidence: what the local kernel and process report;
- routing evidence: which interface, source address, and gateway the host selects;
- packet evidence: which TCP handshake packets actually appear at the observation point.
By the end, you should be able to distinguish a local routing error, a refused port, a silent packet drop, a host-level restriction, and a failure that occurs after TCP has connected. That distinction is essential both in production and in a timed troubleshooting interview.
Make the reported failure concrete
“The service cannot connect” is not yet a useful technical statement. A single hostname can resolve to multiple IPv4 and IPv6 addresses, a load balancer can direct different connections differently, and one port can be open while another is closed.
Begin by recording:
- The affected process or service.
- The exact destination hostname, resolved IP address, and TCP port.
- Whether the failure occurs for IPv4, IPv6, or both.
- The application’s exact error message and timestamp.
- Whether failures are universal, intermittent, or limited to one node, subnet, or deployment.
For this lesson, assume the application should reach:
api.internal.example:443
and DNS resolution has already identified an intended IPv4 address:
10.20.30.40:443
Use the IP address initially. That removes DNS variability from this specific investigation. Keep the original hostname recorded, however: later, it helps validate TLS name handling and load-balancer behavior.
A controlled TCP probe is useful, provided you interpret it narrowly:
dst=10.20.30.40
port=443

timeout 5 nc -vz -w 3 "$dst" "$port"
Typical outcomes have different meanings:
| Result | What it suggests | What it does not prove |
|---|---|---|
| Connection succeeded | A TCP handshake completed to that IP and port. | The application protocol, authentication, TLS validation, or request handling works. |
| Connection refused | A TCP reset was received or generated locally; the peer actively rejected the connection in many cases. | The intended application is running or that no firewall generated the reset. |
| Timed out | The TCP handshake did not complete within the probe’s timeout. | Exactly where packets were dropped. |
| No route to host / network unreachable | The local network stack could not find a usable route or received an unreachable condition. | That the remote service is unhealthy. |
Do not use ping as proof of TCP connectivity. Ping tests ICMP, while the application requires a particular TCP destination port. ICMP may be blocked even when TCP works, and it may work while TCP port 443 is filtered.
Also, do not jump to “firewall issue” from a timeout. A timeout is a symptom with several plausible causes: an absent route, a security control dropping packets, an unhealthy target, asymmetric return routing, or a connection limit.
TCP’s handshake gives failure signatures meaning
TCP normally establishes a connection through a three-way handshake. The client sends a SYN to request a connection. The server replies with SYN+ACK if it is prepared to establish one. The client sends the final ACK.
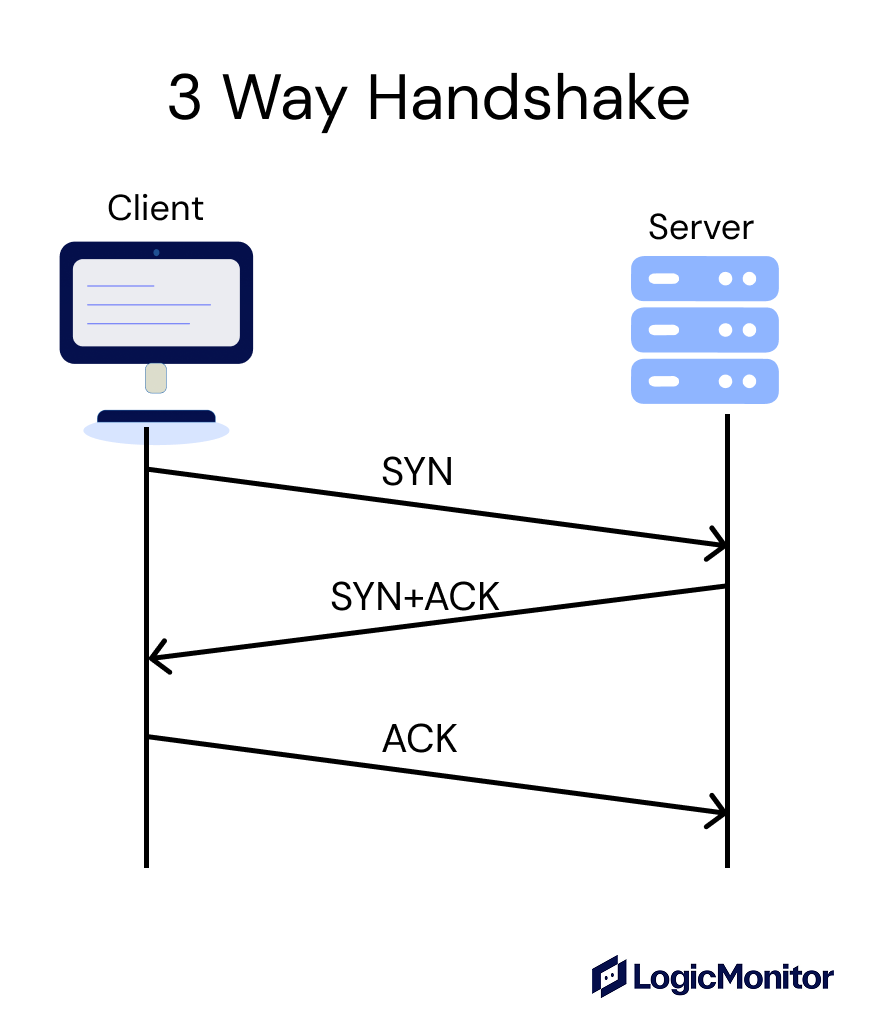
At a little more detail, suppose the client starts with sequence number and the server starts with sequence number :
- Client sends
SYN, sequence . - Server sends
SYN+ACK, acknowledgement , sequence . - Client sends
ACK, acknowledgement .
A SYN consumes one sequence-number position even though it carries no application payload. Once the final ACK is received by the server, both peers can regard the connection as established. The client’s third packet may also contain application data.
This handshake produces a practical diagnostic vocabulary:
- SYN is displayed as
[S]in commontcpdumpoutput. - SYN+ACK appears as
[S.]; the period denotes ACK. - ACK appears as
[.]. - RST appears as
[R]and actively tears down or rejects a connection attempt. - FIN appears as
[F.]and normally begins a graceful close.
The following short video is worth watching before you capture live traffic. It demonstrates why numeric addresses, limited captures, and focused filters matter, then connects TCP flags to the handshake you will use as evidence.
Watch “Introduction to TCPDUMP” by David Mahler to learn the small set of tcpdump options and output fields needed for a safe, focused TCP diagnosis.
Start with capture setup for interface discovery, capture limits, and numeric output. Then watch TCP output, which explains timestamps, endpoint tuples, TCP flags, and contrasts a closed port with a completed handshake. Finish with traffic filters; focus on filtering by host, direction, port, protocol, and TCP flags rather than collecting unrelated production traffic.
A successful handshake establishes only the transport layer. If nc connects but the application fails, do not keep changing security-group or route settings. The next failure may be TLS, protocol negotiation, proxy behavior, authentication, or application overload. The next lesson will examine TLS failures specifically.
Start at the local socket: what did the kernel do?
The application cannot emit a TCP SYN without first asking the local kernel to create and connect a socket. This is the fastest boundary to check because it separates an application-side failure from a network-path failure.
If you know the affected process ID from service inspection, capture only a short reproduction:
pid=1234

sudo timeout --signal=INT 15s \
  strace -ff -tt -s 128 \
  -e trace=network \
  -p "$pid" \
  -o "/tmp/connect-trace.${pid}"
Trigger one connection attempt, then inspect the result:
sudo grep -E 'socket|connect|getsockopt|sendto|recvfrom' \
  /tmp/connect-trace."$pid"*
Common connect() outcomes are powerful evidence:
connect(... 10.20.30.40:443 ...) = -1 ECONNREFUSED
connect(... 10.20.30.40:443 ...) = -1 ETIMEDOUT
connect(... 10.20.30.40:443 ...) = -1 ENETUNREACH
connect(... 10.20.30.40:443 ...) = -1 EHOSTUNREACH
Interpret them carefully:
ECONNREFUSEDusually aligns with receiving a TCP RST. It means the connection was actively rejected, not silently dropped.ETIMEDOUTmeans the connection did not complete before the kernel or application timeout. Packet capture is needed to locate the missing response.ENETUNREACHorEHOSTUNREACHpoints toward the local machine’s routing decision or an unreachable condition it received.EADDRNOTAVAILcan occur when a client cannot allocate a usable local source address or ephemeral port. It is a local resource symptom, not a remote firewall verdict.
If attaching strace is not appropriate for a production service, application logs plus socket inspection can still show whether a connection is in progress.
The ss command exposes the Linux kernel’s current socket table. For troubleshooting, use numeric output so that ss does not add its own name lookups:
sudo ss -tanp
The key states during a connection incident are:
| Socket state | Meaning during diagnosis |
|---|---|
SYN-SENT | This host sent a SYN and is waiting for a SYN+ACK. |
SYN-RECV | Usually visible on a server that received a SYN and awaits the final ACK. |
ESTAB | The TCP handshake completed. Any remaining failure is above TCP or concerns later connection loss. |
TIME-WAIT | A recently closed connection remains tracked temporarily; high volume can reveal connection churn. |
LISTEN | A local process is ready to accept new TCP connections on a port. |
To inspect a specific outbound connection attempt:
sudo ss -tanpo state syn-sent \
  "( dst $dst and dport = :$port )"
To inspect established connections to the same destination:
sudo ss -tanpi \
  "( dst $dst and dport = :$port )"
The -i option provides internal TCP information such as retransmission timeout, retransmission behavior, round-trip time, congestion window, and bytes transferred. On a live incident, this can reveal that connections are not merely “slow”; they may be retransmitting and waiting for a missing peer response.
Read the relevant portions of the ss manual page to make socket state and filtering output precise evidence rather than a command you run by habit.
In the opening option reference, review the descriptions of -n, -a, -o, -p, -i, and -t; focus on why numeric output prevents unintended name resolution and why -i reveals retransmission and RTT information. Then find the STATE-FILTER section and read the available states, especially syn-sent, syn-recv, and established. In the following EXPRESSION section, locate the destination and port predicates so you can constrain ss to one destination IP and port.
A SYN-SENT socket is strong evidence that the local kernel did create a connection attempt. It does not prove that the SYN reached the destination. It tells you to move outward: first confirm route selection, then observe the packets.
If the application runs in a container, inspect from its actual network namespace. The host may have a route that the container does not, and a Kubernetes pod’s network path can differ materially from the node’s.
For a host process with a distinct network namespace:
sudo nsenter -t "$pid" -n ip route get "$dst"
sudo nsenter -t "$pid" -n ss -tanp
For Kubernetes, the equivalent principle is to inspect from the affected pod, not merely from a convenient administrative node.
Prove the selected route before blaming the network
Linux does not send packets based on a vague idea of “the default gateway.” It applies routing rules and route tables to select a source address, interface, next hop, and route.
Ask the kernel exactly what it would use:
ip route get "$dst"
Representative output might look like:
10.20.30.40 via 10.20.0.1 dev eth0 src 10.20.0.15 uid 1000
    cache
Read this as evidence:
via 10.20.0.1is the selected next-hop gateway.dev eth0is the egress interface.src 10.20.0.15is the source address the kernel intends to use.
This output tells you where to capture packets. Capturing on the wrong interface is one of the easiest ways to reach a false conclusion that “no SYN left the host.”
A route lookup can instead reveal an immediate local issue:
RTNETLINK answers: Network is unreachable
or a route that uses an unexpected interface, such as a public NIC rather than a VPN interface. In either case, a remote firewall is not your first suspect.
Most hosts use the main routing table, but multi-homed hosts, VPN clients, service meshes, and policy-based networking can use more than one table. If ip route get looks surprising or behavior differs by source address, inspect policy routing:
ip rule show
ip route show table all
Treat these commands as an escalation, not a routine dump. The important question is whether a rule selects a different table based on source address, packet mark, or other criteria relevant to the application.
For a target on the same Layer 2 subnet, neighbor resolution is another useful local check:
ip neigh show
An INCOMPLETE or FAILED neighbor entry can explain why the host cannot deliver packets directly to a local-subnet destination. For a destination reached through a gateway, the relevant neighbor is usually the gateway, not the remote destination.
Capture a small amount of decisive traffic
Packet capture turns a reasonable hypothesis into a narrower conclusion. Capture during one deliberate reproduction, on the interface selected by ip route get, with an endpoint-and-port filter.
iface=eth0

sudo tcpdump -ni "$iface" -s 96 -c 30 \
  "host $dst and tcp port $port"
Why these options?
-navoids reverse DNS and service-name lookups that clutter or alter the observation.-i "$iface"observes the actual egress interface selected by the route.-s 96is enough for TCP headers and handshake evidence while minimizing captured payload.-c 30stops automatically, protecting you from accidental long captures.- The filter limits capture to the relevant endpoint and TCP port.
Avoid payload options such as -A or -XX unless there is a specific, approved need. Packet payloads can contain credentials, session cookies, authorization headers, or user data. For connection setup, packet metadata and TCP flags are normally sufficient.
Here are the core packet-level signatures.
1. SYN leaves; no response returns
10.20.0.15.49152 > 10.20.30.40.443: Flags [S], ...
10.20.0.15.49152 > 10.20.30.40.443: Flags [S], ...
10.20.0.15.49152 > 10.20.30.40.443: Flags [S], ...
The host is attempting the connection and retransmitting SYN packets. No SYN+ACK or RST is observed at the client.
A defensible conclusion is:
The client is transmitting TCP SYN packets toward
10.20.30.40:443, but no response is arriving at this client during the capture window.
Possible causes remain open:
- an outbound host firewall or network security device drops traffic after the capture point;
- a route, NAT, VPN, or transit path is broken;
- an inbound firewall or security control drops the SYN;
- the target does not respond;
- the return path is asymmetric or blocked.
Do not state “the target firewall is blocking it” without evidence from a target-side capture, flow logs, or network-path analysis.
2. SYN leaves; destination returns RST
10.20.0.15.49152 > 10.20.30.40.443: Flags [S], ...
10.20.30.40.443 > 10.20.0.15.49152: Flags [R.], ...
An active rejection occurred. Often, this means no process is listening on port 443 at the destination. It may also be a deliberate rejection by a host firewall, load balancer, proxy, or middlebox.
The right next evidence is on the destination side:
sudo ss -ltnp "( sport = :443 )"
sudo systemctl status your-service.service --no-pager
If the expected process is listening locally but clients receive RST, verify the destination IP, virtual-IP or load-balancer mapping, host firewall rules, and whether traffic reaches the intended host at all.
3. SYN, SYN+ACK, ACK appear
10.20.0.15.49152 > 10.20.30.40.443: Flags [S], ...
10.20.30.40.443 > 10.20.0.15.49152: Flags [S.], ...
10.20.0.15.49152 > 10.20.30.40.443: Flags [.], ...
TCP connectivity succeeded.
At that point, stop describing the incident as a TCP connection failure. Check whether the application immediately sends a TLS ClientHello, HTTP request, database startup packet, or some other protocol data. A failure after this point belongs to a higher layer, even if the application reports it loosely as “connection failed.”
4. No SYN appears in the client-side capture
If the application says it attempted a connection but no SYN appears on the route-selected interface, revisit the local boundary:
- Was the application actually reproduced during the capture?
- Is the process in another network namespace?
- Did
ip route getselect a different interface or source address? - Did
connect()fail immediately with a local error? - Is a host-level firewall or policy routing rule blocking the connection before it reaches this interface?
A capture only proves what it saw at its own observation point. Its strongest use is to identify the last confirmed boundary, not to claim visibility into the entire network.
Cloud controls: stateful security groups, stateless network ACLs
In AWS, an OS-level route and a TCP SYN leaving an instance are necessary but may not be sufficient. VPC controls can allow or deny traffic at different layers.
Security groups are stateful. When a connection is allowed in one direction, response traffic for that tracked connection is automatically permitted. For a common client-to-service flow, the destination security group must allow inbound TCP traffic on the service port from the client’s security group or source CIDR. If the client security group has the normal default of allowing all outbound traffic, no additional client outbound rule is usually required.
Network ACLs are stateless and apply to subnets. They must permit both directions independently:
- client outbound traffic to the destination service port;
- client inbound return traffic to the client’s ephemeral source port;
- destination inbound traffic to the service port;
- destination outbound return traffic to the client ephemeral port.
This return-path requirement is a frequent source of confusion. A network ACL that allows inbound port 443 to a target but blocks outbound ephemeral ports can cause a connection attempt to look like a timeout because the SYN+ACK cannot return.
Persistent connection issues - Amazon ElastiCache
Read the AWS troubleshooting guidance as a concrete example of separating stateful security-group behavior, stateless network ACL behavior, routing, and operating-system validation. Although the example uses ElastiCache, the TCP reasoning applies to many AWS private-service connections.
In the Security groups and Network ACLs portions, read the security-group explanation, then compare it with the stateless Network ACL discussion immediately below. In Route tables, read the routing guidance. Finally, in Network connectivity validation, read the validation workflow. Focus on why a passing Reachability Analyzer result and an OS-level failure call for checking host firewalls, asymmetric routing, or local restrictions.
For an AWS-only path, VPC Reachability Analyzer can validate intended connectivity between a source instance or network interface and a destination network interface for a specified TCP port. It is especially useful for identifying an offending route, security group, or network ACL rule. It models configuration, however; it does not replace packet evidence from a live workload, and it cannot prove application readiness.
If VPC analysis says the path is reachable but the application’s TCP connection still fails, focus on evidence that exists below or outside the modeled path:
- host firewall rules;
- container or pod networking;
- policy routing;
- operating-system limits;
- asymmetric routes;
- a target process that is not listening;
- an overloaded or connection-limited endpoint.
Check connection pressure only when the symptom supports it
A failure that happens only under load can be caused by client-side connection churn, ephemeral-port pressure, or connection-tracking limits. Do not lead with these explanations for a single, stable failure, but test them when new connections begin failing while existing connections remain healthy.
Inspect the client’s configured ephemeral-port range:
sysctl net.ipv4.ip_local_port_range
Count connections to one destination tuple:
sudo ss -Htan state established \
  "( dst $dst and dport = :$port )" | wc -l

sudo ss -Htan state time-wait \
  "( dst $dst and dport = :$port )" | wc -l
A large number of TIME-WAIT sockets is not automatically a defect. It becomes meaningful when paired with high connection creation rates, short-lived connections, errors such as EADDRNOTAVAIL, or observed resource limits. In that case, inspect application pooling behavior and retry patterns rather than simply increasing timeouts.
In AWS, tracked-connection and network-rate limits can also prevent new connections while existing ones continue. The symptom often looks like intermittent timeouts under load, so correlate connection counts and relevant CloudWatch or ENA metrics with the incident window before changing infrastructure rules.
A repeatable investigation sequence
For a real incident or interview case, use this sequence:
- Define the tuple. Record the application, timestamp, destination IP, port, and address family. Keep hostname resolution separate from TCP testing.
- Reproduce minimally. Use a short TCP probe such as
ncand record whether the result is success, refusal, timeout, or a local routing error. - Inspect the affected process. Use logs and, when safe,
straceto find the actualconnect()result. - Inspect kernel socket state. Use filtered
ssoutput. ASYN-SENTsocket is evidence of an incomplete local handshake attempt. - Ask the kernel for its route. Use
ip route getto identify source address, next hop, and egress interface. - Capture a bounded packet trace. Reproduce once while collecting filtered
tcpdumpoutput on the selected interface. - Interpret the handshake signature. Determine whether you observed no SYN, repeated SYNs, a RST, or a complete handshake.
- Only then inspect the appropriate control plane. Check host firewall rules, AWS routes, security groups, network ACLs, VPN state, or target listener evidence according to what the packets support.
- State the boundary of certainty. Say what is proven, what is likely, and the smallest next check.
A concise interview-quality explanation might sound like this:
“I would first confirm the exact destination IP, port, address family, and failure timestamp from the affected service, since DNS success does not prove TCP reachability. I would reproduce the connection with a short TCP probe and inspect the service’s
connect()error. Next I would use filteredssoutput to check forSYN-SENTor established sockets, then runip route getfor the destination to identify the source address and egress interface. During one reproduction, I would capture only that host and TCP port withtcpdump. Repeated SYNs without a reply prove the client is transmitting but not receiving a response at that point; a RST indicates active rejection; and a completed SYN, SYN+ACK, ACK sequence proves TCP is working and moves the investigation to TLS or the application protocol. In AWS, I would validate the corresponding route, security-group, and bidirectional network-ACL path, while distinguishing those configuration checks from observed runtime packets.”
Key takeaways
- A TCP incident must be framed as a specific destination IP, port, address family, process, and time window.
connect()errors andsssocket states establish what the local kernel knows;SYN-SENTmeans the handshake has not completed.ip route getis direct evidence of the selected route, source address, gateway, and capture interface.- A packet capture distinguishes four important cases: no observed SYN, repeated unanswered SYNs, an active RST, and a completed handshake.
- A timeout does not identify a firewall by itself. It proves only that the handshake did not complete within the relevant timeout.
- Security groups are stateful; AWS network ACLs are stateless and must allow both the service port and the ephemeral return path.
- A completed TCP handshake is the handoff point to the next layer of troubleshooting.
Next, you will isolate TLS handshake failures using certificate, hostname, protocol-version, and packet-level evidence.
Can't find a good explanation? Sign up and we'll make it for you
Sign up