
Hello! Welcome to the third lesson in our module on Customer Value and Segmentation Strategy.
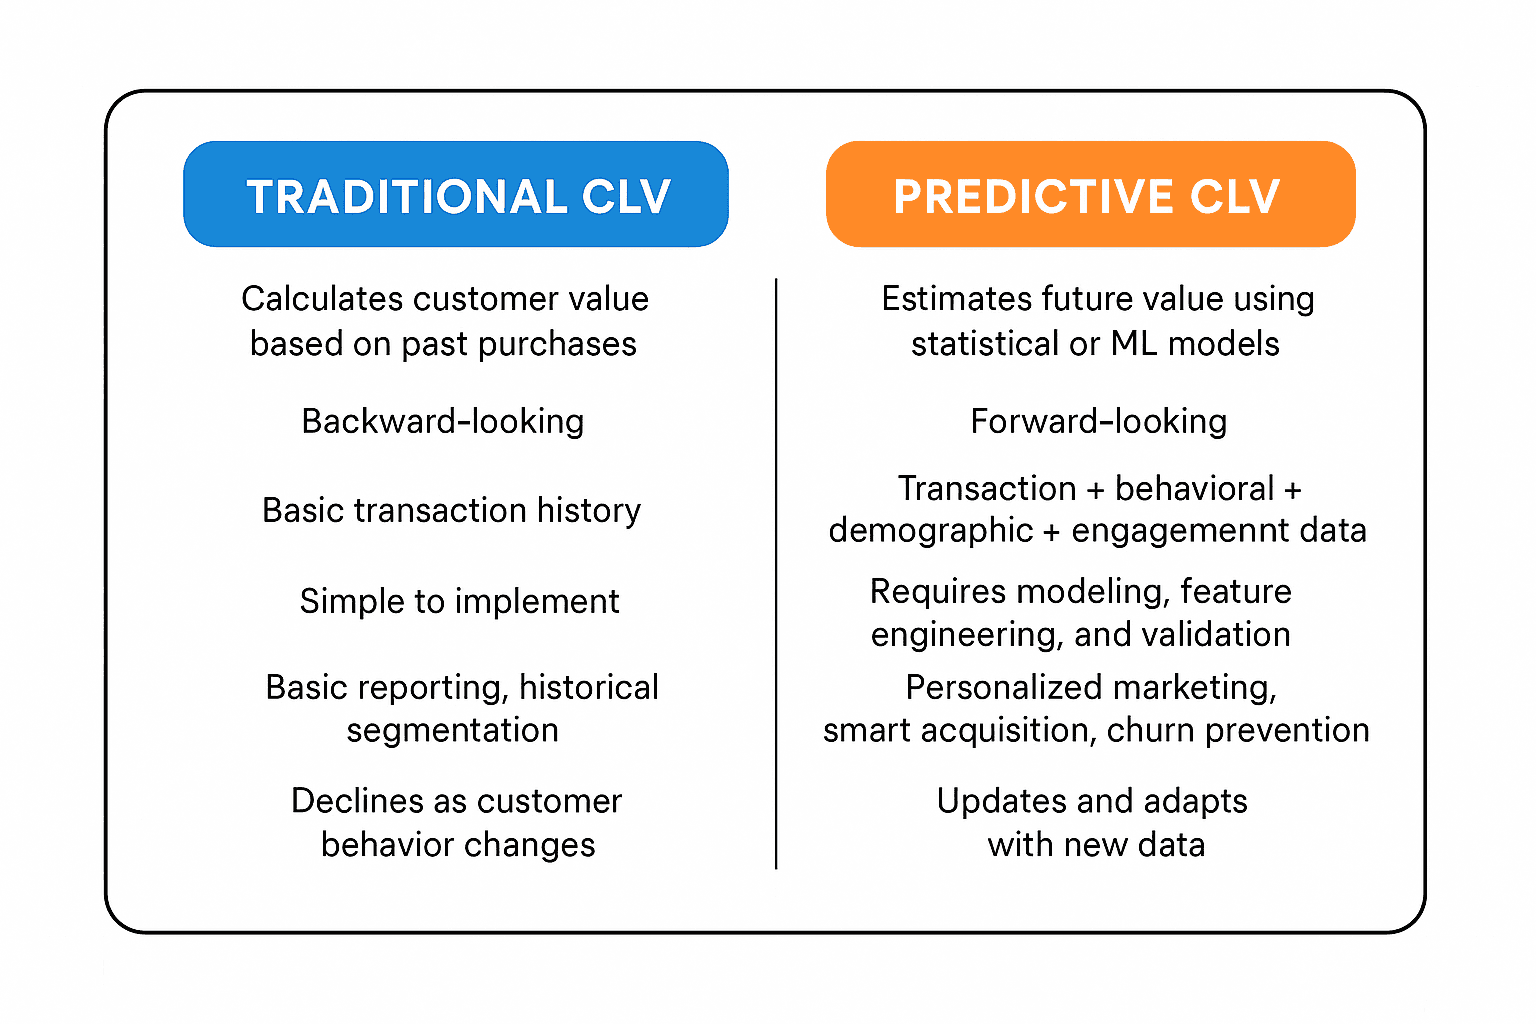
In our last session, we made a critical leap from looking in the rearview mirror with historical LTV to looking through the windshield with predictive LTV (pLTV). You learned how forecasting a customer's future value allows you to make proactive, forward-looking decisions about budget allocation and strategy, rather than reacting to past performance.
Now that we can estimate the value of an individual customer, the next logical question is: How do we group similar customers together to market to them more effectively? A single pLTV score is powerful, but its true strategic value is unlocked when used to create distinct customer segments.
This brings us to today's learning outcome: to evaluate customer segments derived from analytical models (e.g., RFM, clustering, pLTV). We will explore several common segmentation models your analytics team might use and, most importantly, focus on how you, as a strategic leader, can critically assess the business value of the segments they produce.
1. The Strategic Imperative of Segmentation
Before we dive into the models, let's establish why segmentation is a cornerstone of modern performance marketing. Treating every customer the same is inefficient and leaves money on the table. Effective segmentation allows you to tailor your messaging, offers, and channel strategy, which drives significant business impact.
A Step-by-Step Guide to Customer Segmentation Analysis
This article from Saras Analytics provides an excellent overview of the strategic 'why' behind customer segmentation. It also introduces three simple but powerful 'guardrails' for what makes a segment useful.
Please read the sections 'What is Customer Segmentation?', 'What Is Customer Segmentation Analysis?', and 'Why Customer Segmentation Analysis Matters'. As you read, focus on the four key business impacts (Acquisition, Retention, Margin, Product) and the three guardrails for a useful segment: Similarity inside the group Contrast across groups Operational reach
As the article highlights, the goal is to move beyond simple demographics and group customers based on their actual behavior and value. This allows you to personalize communication, protect margins by avoiding unnecessary discounts, and even gain early product insights.
2. Common Analytical Models for Segmentation
As a leader, you'll encounter various segmentation models. You don't need to build them, but you must understand what they do and what kind of insights they produce. Let's cover three of the most common types your team might use: RFM, Clustering, and pLTV-based segmentation.
2.1. RFM Analysis: A Classic Behavioral Model
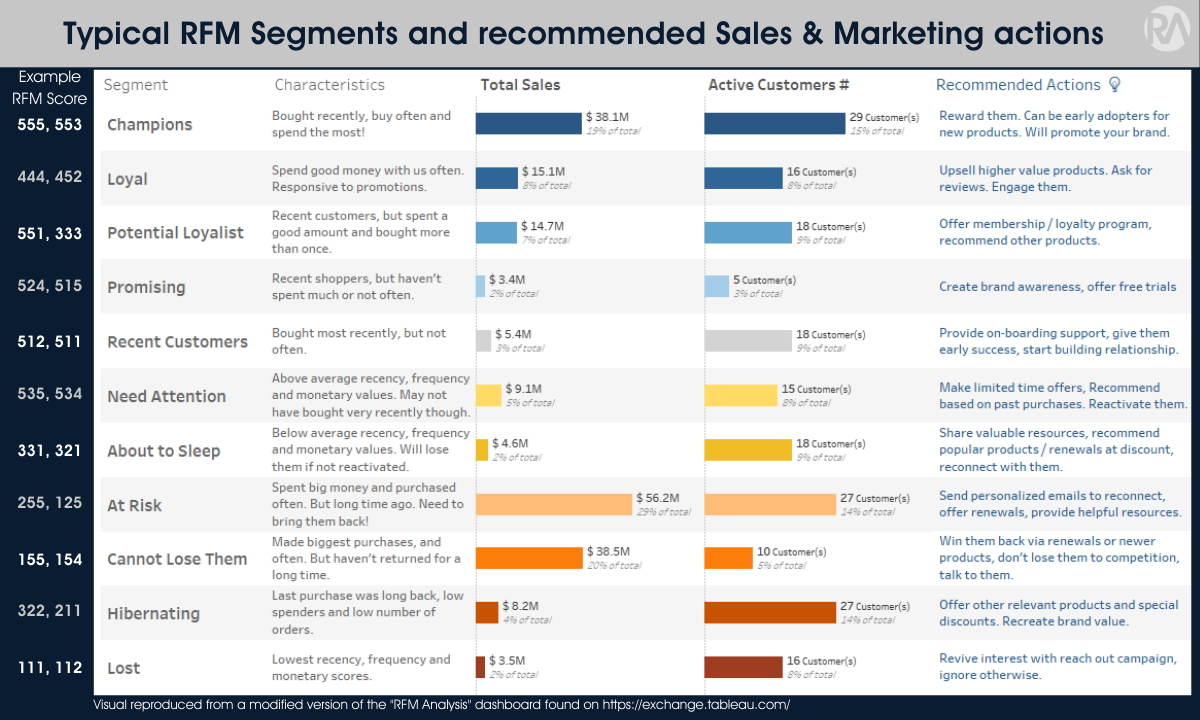
RFM is a time-tested model that segments customers based on their transaction history. It's powerful because it's based on what customers do, not who they are. It scores every customer on three dimensions:
- Recency (R): How recently did they purchase?
- Frequency (F): How often do they purchase?
- Monetary (M): How much do they spend?
Customers are then grouped into segments like "Champions" (high R, F, M), "At Risk" (low R, high F, M), or "New Customers" (high R, low F, M).
To see this in action, let's watch a practical, non-technical walkthrough of building an RFM model in Excel. This will help you grasp the core logic.
Create Powerful Customer Segments for Marketing | Data Analysis for Beginners #4
This video from Absent Data clearly demonstrates the step-by-step process of calculating RFM values, creating scores, and defining segments.
Watch from 01:15 to 19:51. You don't need to follow every Excel formula. Instead, focus on the conceptual steps: Calculating R, F, and M for each customer from raw transaction data (01:15 - 09:12). Creating scores for each dimension (e.g., a 1-10 scale) to standardize the values (09:12 - 14:35). Defining segments based on these scores and naming them (e.g., 'Top Customers', 'At Risk') (14:35 - 19:51). Notice how the final output isn't just data; it's a set of named groups with clear characteristics.
While the Excel approach is great for understanding the concepts, your technical teams will likely use programming languages like Python to automate and scale this analysis. This allows for more sophisticated scoring methods, such as using quantiles (e.g., top 25% of spenders get a score of 4, next 25% get a 3, etc.).
Let's briefly see what that looks like.
Data Science Project - RFM model
This video from Karina Data Scientist shows a similar RFM analysis performed in Python. This reflects how your data science team might approach the task.
Watch from 09:21 to 14:41 and then 15:16 to 20:50. Again, don't worry about the code. Focus on how the analyst: Uses quantiles to create scores from 1-4 for R, F, and M. Combines the scores to create segments like '111' (low R, F, M) and '444' (high R, F, M). Creates more descriptive labels like 'VIP Loyal', 'Potentially Loyal', and 'At Risk' based on the total RFM score. This gives you insight into the vocabulary and process your technical counterparts will use.
2.2. Clustering and pLTV-based Segmentation
While RFM is a structured, rule-based approach, other methods use machine learning to discover segments you might not have thought to look for.
-
Clustering (e.g., K-Means): This is an unsupervised learning technique where you feed the algorithm various customer features (e.g., AOV, days between orders, product categories purchased), and it automatically groups customers into "clusters" based on their similarity across those features. The key difference from RFM is that you don't define the rules upfront; the algorithm finds the patterns for you.
-
pLTV-based Segmentation: This approach connects directly to our last lesson. Once your team has a pLTV score for every customer, you can create value-based segments. For instance:
- VIPs: Top 5% of customers by pLTV
- High Potential: Next 15% of customers by pLTV
- Core Customers: Middle 50%
- Low Value: Bottom 30%
This is incredibly powerful for budget allocation, as it allows you to invest your marketing dollars in direct proportion to the future value a customer is expected to generate.
3. How to Evaluate Segments: A Leader's Framework
Your most critical role is not in building these models but in evaluating their output. When your analytics team presents you with a new set of customer segments, you need to assess their strategic and financial viability.
3.1. Are the Segments Fundamentally Sound?
First, apply the three guardrails we learned from the Saras Analytics article:
- Distinct (Contrast Across Groups): Do the segments represent genuinely different behaviors? If Segment A and Segment B have nearly identical purchase patterns, they aren't two segments; they're one.
- Cohesive (Similarity Inside the Group): Can you speak to everyone in a segment with a single, relevant message? If a segment contains both first-time buyers and decade-long loyalists, it's too broad.
- Actionable (Operational Reach): Can you actually target these segments in your marketing platforms (Meta, Google, Klaviyo, etc.)? A theoretically perfect segment is useless if you can't reach its members.
3.2. Value vs. Profitability: The Most Important Question
This is a subtle but crucial distinction for any strategic leader. A "valuable" customer in RFM terms (high frequency, high monetary value) is not always the most profitable. This is especially true in subscription or high-service businesses where high engagement can also mean high cost-to-serve.
An Analysis of RFM-Based Customer Segmentation and Profitability
This master's thesis, 'Rethinking Customer Value', provides a fantastic real-world analysis of this exact problem in the context of a car wash company with both subscription and pay-per-use customers. It uses RFM and k-means clustering to create segments and then compares their RFM 'value' to their actual profitability.
This is a detailed paper, so let's focus on the key strategic findings: Read the Abstract (page i): It summarizes the core problem: high-engagement customers aren't always profitable, especially in subscription models. Skim the Segment Profiles (pages 30-33, sections 4.1): Look at Tables 4.1 and 4.2 to see the RFM profiles of the subscriber and pay-per-use (PPU) segments. Note Segment 2 ('Loyal High-Value Subscribers') and Segment 4 ('At-risk Long-term Subscribers'). Read 'Profitability of Segments' (pages 34-36, section 4.3): This is the key section. Look at Table 4.3. Notice that Segment 2, the 'most valuable' by RFM standards, has the lowest profit margin (79.3%), while Segment 4, the 'at-risk' group, has the highest profit margin (89.3%). Read the first two paragraphs of 'RFM as a Predictor of Profitability' (page 39, section 5.1.2): This explains why this happens: with subscriptions, high frequency drives up costs while revenue stays flat, eroding margins.
The insight from this paper is profound. Relying solely on platform-reported revenue or a simple RFM model could lead you to over-invest in a segment that, while active, is actually less profitable than a less-engaged group. Your role is to challenge your team to go beyond surface-level value metrics and analyze true profitability, including the cost-to-serve.
3.3. From Evaluation to Action
Once you've validated that your segments are sound and you understand their profitability, the final step is to define a clear action plan for each.
Test your understanding!
Your analytics team presents a segmentation of your e-commerce customer base.
- Segment A ("Deal Hunters"): These customers have high Frequency and high Monetary value. They almost exclusively buy during major sales events. Their profit margin is 15%.
- Segment B ("Quiet Loyalists"): These customers have moderate Frequency and moderate Monetary value. They buy consistently throughout the year, almost always at full price. Their profit margin is 60%.
The team lead recommends spending the majority of the Q4 retention budget on a large-scale promotional campaign to re-engage Segment A. Based on what you've learned, how would you evaluate this recommendation? What questions would you ask?
Show answer
This is a classic scenario where you need to look beyond top-line metrics (Frequency, Monetary) and consider profitability.
Evaluation of the Recommendation:
The recommendation to focus on Segment A is questionable. While they have high F and M values, their profitability is extremely low (15%). Investing heavily in a promotional campaign for them would likely further erode margins and attract customers who are only loyal to the discount, not the brand. Segment B, despite having lower top-line metrics, is far more profitable (60%) and represents a healthier customer base.
Strategic Questions to Ask:
- "What is the total profit contribution of each segment, not just the revenue?" While Segment A might have higher revenue, Segment B could be contributing more to the bottom line.
- "What is the incremental impact of promotions on Segment A? Are we just pulling future sales forward at a lower margin, or are we genuinely increasing their LTV?" This questions whether the marketing spend is truly effective.
- "What would be the ROI of investing in Segment B instead? For example, could we use the budget for a loyalty program or early access to new products to increase their frequency or AOV, given their high margin?" This shifts the focus from a low-margin segment to a high-margin one, aiming to grow the most profitable part of the business.
- "What is our strategic goal for each segment? Is it to grow revenue (even at low margin) or to maximize profit?" This forces the team to align their tactical recommendation with a higher-level business objective.
Your conclusion should be to challenge the recommendation and pivot the conversation toward investing in the more profitable "Quiet Loyalists" (Segment B).
Conclusion
Today, we've unpacked the process of customer segmentation from a strategic leader's perspective. You've learned about the common analytical models used to create segments and, more importantly, how to evaluate their business relevance.
Key Takeaways:
- Customer segmentation is essential for moving beyond one-size-fits-all marketing to drive efficiency, retention, and margin control.
- Common analytical models include RFM (scoring on Recency, Frequency, Monetary), Clustering (uncovering natural data groupings), and pLTV-based segmentation (grouping by future value).
- A good segment must be distinct, cohesive, and actionable.
- The most critical evaluation is understanding the difference between a customer's RFM-based "value" and their true profitability. High engagement does not always equal high profit.
Preview of the Next Lesson:
We have now identified and evaluated our customer segments. The next step is to decide what we want to achieve with each one. In our next lesson, we will focus on how to formulate distinct marketing objectives for different customer segments (e.g., activation, retention, monetization). This will bridge the gap between analysis and execution, allowing you to set clear, targeted goals for your marketing team.