
Hello! Welcome back to your personalized course on Medical Instrumentation.
In our last lesson, we dove into the world of sensor fusion, discovering how to combine data from accelerometers, gyroscopes, and magnetometers to create a robust, drift-free estimate of 3D orientation. This gave us the foundational tool for understanding how a wearable device is oriented in space.
Today, we'll build directly on that foundation. Our learning outcome is to design an instrumentation setup to measure motor responses, such as reaction time and movement tracking. We will move from simply knowing a device's orientation to designing complete systems that capture and quantify specific human actions. This is a critical step for your work at Neuraease, as quantifying motor responses like reaction speed or restlessness is key to building a complete picture of an individual's state.
1. The Building Blocks of a Motor Response System
At its core, any system designed to measure a motor response to a stimulus consists of four key components:
- Stimulus Generator: The event that triggers the response (e.g., a light, a sound, a vibration).
- Response Sensor: The component that detects the user's physical action (e.g., a button press, movement across a beam, a change in force).
- Controller: The "brain" of the system, typically a microcontroller. It controls the stimulus, starts a timer, detects the response, stops the timer, and calculates the result.
- Display/Output: A way to present the measured data (e.g., an LCD screen, data sent to a computer).
We'll start with the classic example: measuring simple reaction time.
2. Designing a Reaction Time Measurement Device
Reaction time is the interval between the presentation of a stimulus and the initiation of a motor response. It's a fundamental measure of neural processing and cognitive speed.
To get a feel for a simple, practical implementation, let's look at a project built around an Arduino.
Arduino Based Reaction Time Game
This video, "Arduino Based Reaction Time Game" from the learnelectronics channel, provides a perfect hands-on demonstration of a simple reaction time system. It will show you all the core components in action.
Watch the first 2 minutes and 37 seconds of the video. Pay attention to the basic sequence of events (lights, button press, display) and the electronic components used (Arduino, LEDs, button, LCD screen).
This simple game perfectly illustrates the four building blocks:
- Stimulus: The green LED turning on.
- Response Sensor: The push button.
- Controller: The Arduino board.
- Display: The LCD screen.
The Critical Component: Timing Logic
The most crucial part of the controller's job is timing. Since your background is in ECE, you'll know that microcontrollers operate on clock cycles, allowing for very precise time measurement. Let's see how this is implemented in code.
Arduino Based Reaction Time Game
We'll continue with the same video to look at the Arduino code. This is where the magic happens.
Now, watch the section from 02:37 to 07:28. Focus specifically on how the millis() function is used to capture a startTime and stopTime, and most importantly, how the final reaction time is calculated by subtracting not just these times, but also the known, fixed delays in the code.
The key principle here is: Reaction Time = stopTime - startTime - knownDelays. The millis() function returns the number of milliseconds since the program started. By capturing its value right when the stimulus is presented (startTime) and right when the response is detected (stopTime), you can get a precise duration. Forgetting to subtract the duration of other programmed delays is a common source of error in such systems.
Exploring Design Alternatives
The simple "light and button" is just one way to build a reaction time device. The choice of stimulus and response mechanism can be tailored to the specific question you're asking. A comprehensive design process involves brainstorming and evaluating multiple options.
Reaction Time Measurement Device - BME Design Projects
This BME Design Project report, "Reaction Time Measurement Device", explores this design process in fantastic detail. We'll start by looking at different types of reaction time and then some creative design alternatives.
First, read the 'Background and Motivation' section (page 4) to understand the different types of reaction time (Simple, Go/No-Go, Choice, Discrimination). Then, skim through the 'Design Alternatives' section (pages 6-12), paying attention to the LASER, Ruler, and Ambulance designs. Notice how each one implements the stimulus and response sensor differently.
This report shows how varied the implementation can be. For instance, the "LASER Design" uses an interesting response sensor: an infrared (IR) beam that is broken when the user's hand moves, demonstrating a non-contact method of detecting movement.
Test your understanding!
Based on the reading, how would you modify the simple Arduino setup from the video to measure Choice Reaction Time? For example, reacting to either a red or a blue light with a corresponding red or blue button. Sketch a quick block diagram.
Show answer
Your block diagram would need a few key changes:
- Stimulus Generator: You would need two stimuli (e.g., a red LED and a blue LED).
- Response Sensor: You would need two response inputs (e.g., a red button and a blue button).
- Controller Logic: The Arduino code would have to be more complex. It would need to:
- Randomly choose which light to turn on.
- Start the timer.
- Monitor both buttons.
- When a button is pressed, stop the timer and check if it was the correct button for the light that was shown.
- Display the reaction time and whether the choice was correct.
3. Case Study: An Advanced Motor Response System
Let's move to a more complex system that measures not just reaction time, but also the force profile of a motor response. The master's thesis "Development of a Real-time Performance Measurement System" details the design of instrumented sprint starting blocks. This is an excellent case study in sensor selection and signal conditioning.
Sensor Selection and Signal Conditioning
The designers needed a sensor to measure the explosive force from the sprinter's feet. They considered several options.
Development of a Real-time Performance Measurement System ...
Let's examine the sensor selection process from the thesis. This is a great example of design thinking in instrumentation.
Read the section just before 4.3 Micro-Controller Design (page 42) that begins with "A number of sensors were considered...". Note which sensors were considered (Strain Gauge, Load Cell, FSR) and why they were rejected in favor of the piezo-electric disc.
They chose a piezo-electric disc, which generates a voltage proportional to applied pressure. However, connecting this sensor directly to the Arduino presents two problems that will be familiar from your ECE studies:
- Voltage Protection: Piezo sensors can generate high voltage spikes (>5V) that would damage the Arduino's input pins.
- Signal Type: They produce an AC voltage, but the Arduino's analog-to-digital converter (ADC) is designed for positive DC voltages.
The solution is a signal conditioning circuit.
Development of a Real-time Performance Measurement System ...
The thesis describes the custom electronic shield built to solve these problems. This is a perfect 'just-in-time' refresher on practical circuit design.
Read the section '4.3 Micro-Controller Design' (pages 43-46) and look at the circuit diagram in Appendix E (page 108). Focus on understanding the purpose of these components: Zener diode: To clamp the input voltage to a safe level (e.g., 5V). Rectifier: To convert the AC signal to DC. RC circuit (Resistor-Capacitor): To act as a low-pass filter, smoothing the rectified signal and helping drain residual charge.
This setup—sensor, conditioning circuit, and microcontroller—is a classic instrumentation chain. The raw physical phenomenon (force) is transduced into a raw electrical signal (AC voltage), which is then conditioned into a clean signal (smoothed DC voltage) that the controller's ADC can accurately digitize.
4. Tracking Continuous Movement
So far, we've focused on discrete events. But what about tracking continuous movement, like analyzing a person's walk or identifying restless fidgeting? This is where the sensor fusion techniques from our last lesson become the enabling technology.
The output of a sensor fusion algorithm is a continuous stream of orientation data (roll, pitch, yaw). By placing an IMU on a body part, we can track its movement over time.

Application: Gait Analysis
A classic application of movement tracking is gait analysis—the study of human walking. By placing an IMU on a person's foot or lower leg, we can analyze the distinct phases of their walking pattern.
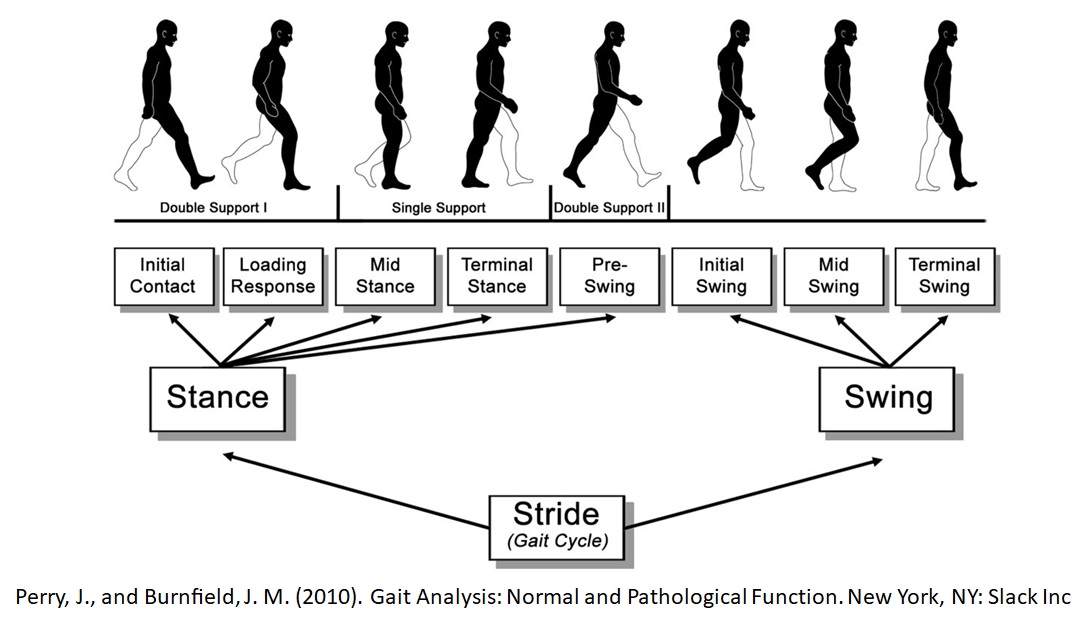
How would an IMU detect these phases?
- Swing Phase: The gyroscope would measure a large, clean peak of angular velocity as the leg swings forward.
- Stance Phase: The gyroscope signal would be relatively flat.
- Initial Contact (Heel Strike): The accelerometer would detect a distinct shock or spike upon impact with the ground.
For your work at Neuraease, you could apply the same logic to detect and quantify restless leg movements or pacing. The pattern of IMU data for "walking across a room" is very different from the pattern for "anxiously tapping a foot" while seated.
Conclusion
In this lesson, we moved from theory to practice, learning how to design instrumentation setups to capture motor responses. We saw how a complete system involves a stimulus, a response sensor, and a controller with precise timing logic.
Key Takeaways:
- A motor response measurement system consists of a stimulus, a response sensor, a controller, and a display.
- Precise timing is critical and must be implemented carefully in software, accounting for all system delays (e.g., using
millis()in Arduino). - Sensor selection is a key design step, involving trade-offs between sensitivity, cost, and robustness.
- Raw sensor signals often require signal conditioning (e.g., amplification, filtering, voltage protection) before they can be processed by a microcontroller.
- The continuous orientation data from fused IMU signals is the foundation for tracking complex movements like gait or analyzing behavioral patterns.
Preview of the Next Lesson:
We have now designed systems to generate rich streams of data about motor responses. The next logical question is: what do we do with all this data? In our next lesson, we will focus on methods for analyzing behavioral patterns from continuous wearable sensor data, bridging the gap from measurement to interpretation.
Can't find a good explanation? Sign up and we'll make it for you
Sign up