
Hello! Welcome to the next lesson in your personalized study of Medical Instrumentation.
In our last session, we designed instrumentation setups to capture motor responses. We saw how to build systems for measuring reaction time and how to use fused IMU data to track continuous movements like walking. We successfully generated rich streams of sensor data.
Today, we address the next logical step. The learning outcome for this lesson is to describe methods for analyzing behavioral patterns from continuous wearable sensor data. We will explore how to transform the raw, high-frequency data from wearable sensors into meaningful insights about a person's activities and state. This is the heart of what your startup, Neuraease, aims to do—translating sensor readings into actionable behavioral information.
1. From Raw Data to Behavioral Insight
The continuous data stream from a wearable device (like an IMU) is a form of "big data." It has high volume (many data points), high velocity (produced rapidly), and can be multimodal (combined with other sensors). Simply looking at these streams of numbers is not enough; we need a systematic way to extract patterns.
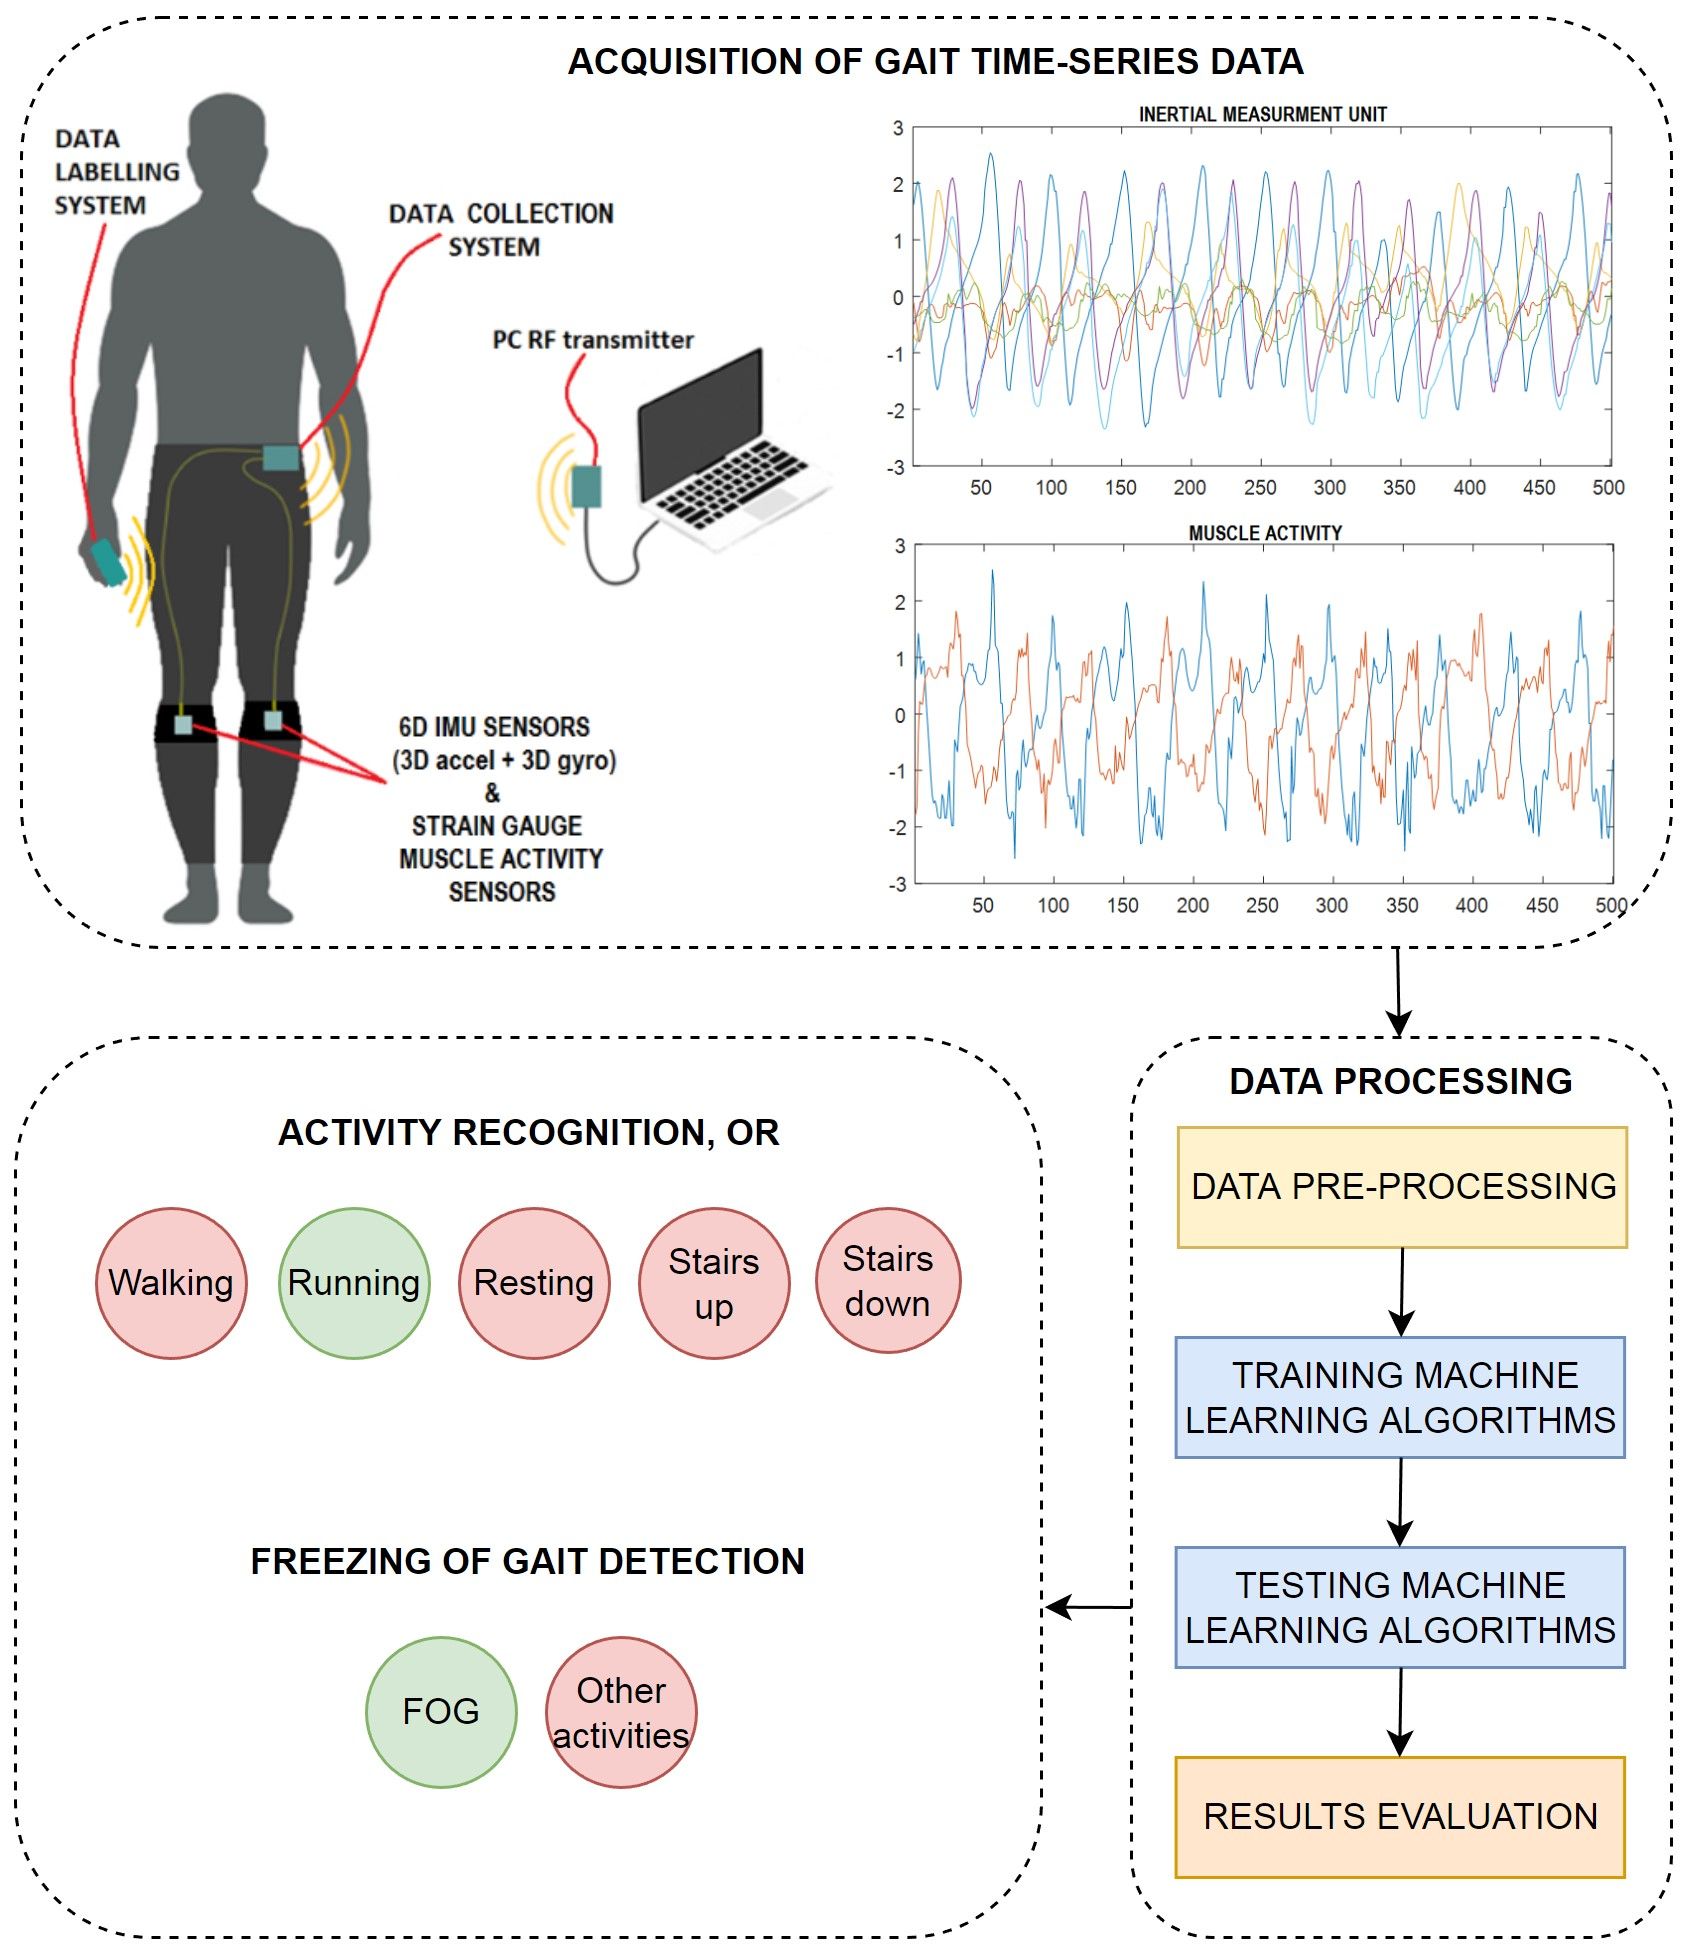
The process of turning this raw data into insights is often called a data analysis pipeline. A paper you may find interesting, "Lessons Learned for Behavior Analysts from Data Scientists," frames this challenge perfectly for your field. It highlights that analyzing these complex datasets requires methods beyond traditional human analysis.
We will structure our exploration around two primary machine learning approaches described in that paper:
- Supervised Learning: We have labeled data and want to train a model to classify new data into those known categories. This is ideal for Human Activity Recognition (HAR), where we teach a model to recognize predefined activities like 'walking', 'sitting', or 'running'.
- Unsupervised Learning: We don't have predefined labels. We want the model to discover inherent structures or anomalies in the data on its own. This is perfect for anomaly detection, where we want to identify unusual behaviors that might signal a change in state, a core requirement for a "meltdown warning" system.
2. The Analysis Pipeline: Preparing Data for Machine Learning
Before we can apply any learning algorithm, the raw sensor data must be carefully preprocessed. Both research papers and practical tutorials emphasize this stage. The paper "Tutorial on Deep Learning for Human Activity Recognition" calls this the DL-ARC (Deep Learning Activity Recognition Chain).
Let's look at the key steps, which are crucial for success.
Lessons Learned for Behavior Analysts from Data Scientists
The paper "Lessons Learned for Behavior Analysts from Data Scientists" gives an excellent, high-level overview of these essential preprocessing steps. It explains the 'why' behind the technical procedures we'll see later.
Please read 'Lesson 3: Don’t Skip the Pre-Processing Stage'. Focus on understanding the four main steps described: Data Cleaning: Handling missing values and noisy data. Data Integration: Combining data from different sources (we won't focus on this today, but it's important). Data Transformation: Normalizing data to a common scale. Data Dimensionality Reduction / Feature Selection: Reducing the number of variables to improve model performance and efficiency.
Two of these steps are particularly important for continuous time-series data from wearables:
- Segmentation (Sliding Windows): We don't feed the entire continuous stream of data into a model at once. Instead, we chop it into small, overlapping segments or "windows" of a fixed duration (e.g., 2-5 seconds). Each window becomes a single data point for our model.
- Feature Engineering & Selection: A 2-second window of 3-axis accelerometer data at 50 Hz contains 300 raw data points. This is a lot! We can either use Deep Learning to process this raw data directly (as mentioned in the "Tutorial on Deep Learning for HAR" paper) or, more commonly, we can calculate statistical features for each window (e.g., mean, variance, standard deviation, frequency components via FFT). This reduces the dimensionality and gives the model more meaningful inputs. Then, we often perform feature selection to pick only the most informative features, which reduces noise and computational cost.
Now, let's see these steps in action in a supervised learning context.
3. Supervised Approach: Human Activity Recognition (HAR)
HAR is a classic application of analyzing wearable sensor data. The goal is to train a model that can accurately label a window of sensor data with a specific activity.
This end-to-end project video will walk us through the entire pipeline, from loading data to deploying a trained model. It's a fantastic practical demonstration of the concepts we've just discussed.
24. Project 18 : Human Activity Recognition with Smartphones | End To End Machine Learning Projects
Let's begin with the video "Project 18 : Human Activity Recognition with Smartphones" by Data Thinkers. First, we'll understand the problem and the data.
Watch from the beginning to 09:24. This section covers: The problem setup and the dataset (smartphone IMU data). Initial data exploration and cleaning (checking for duplicates/missing values). Encoding the string labels (e.g., 'WALKING') into numbers the model can understand.
The Crucial Step: Feature Selection
The dataset in the video has 561 features! Training a model on all of them is inefficient and can lead to poor performance (a phenomenon known as the "curse of dimensionality"). The video demonstrates a powerful hybrid feature selection strategy.
24. Project 18 : Human Activity Recognition with Smartphones | End To End Machine Learning Projects
Now for the most critical part of the preprocessing pipeline for this problem. The video explains why feature selection is important and then implements a two-step process.
Watch from 13:47 to 32:36. This is a dense but very valuable section. Focus on: The 'Why' (13:47 - 21:19): Understand the reasons for doing feature selection (better performance, preventing overfitting, faster computation). The 'How' (23:48 - 32:36): Observe the practical implementation. They use a filter method (SelectKBest) to quickly reduce from 542 to 200 features, and then a wrapper method (RFE - Recursive Feature Elimination) to refine that down to the best 100 features. This is a robust and common approach.
Training and Deploying the Model
With our 100 best features selected, we can now train our classification model and see how it performs. The final step shows how to save the trained model, which is essential for building a real-world application.
24. Project 18 : Human Activity Recognition with Smartphones | End To End Machine Learning Projects
Let's complete the project. This final part shows how to train the model on the selected features and, importantly, how to save and load it to make predictions on new data.
Watch from 32:36 to 38:46. Notice how the accuracy remains high even with fewer features, and pay close attention to the process of using joblib to save the trained model and feature selectors. This is how you would move from a prototype to a deployed system.
Test your understanding!
The HAR video classifies activities like 'walking', 'sitting', and 'laying'. For your startup, Neuraease, how could you adapt this supervised HAR approach? What specific, labeled "activities" or "behavioral states" might you want to train a model to recognize from wearable data to help predict meltdowns?
Show answer
You could adapt this by defining and labeling a set of relevant behavioral states. Instead of 'walking', 'sitting', etc., your labels might be:
calm_sitting(low movement)restless_fidgeting(small, repetitive movements while seated)agitated_pacing(repetitive walking in a confined space)hand_flapping(a specific rhythmic arm movement pattern)rocking(rhythmic torso movement)
To do this, you would need to collect data and have it carefully labeled by an expert (or the user themselves) to create the "training set" for your supervised learning model.
4. Unsupervised Approach: Anomaly Detection
What if we don't know exactly what pattern we're looking for? What if the precursor to a meltdown isn't a pre-defined activity, but simply a deviation from the user's normal baseline? This is where unsupervised learning, specifically anomaly detection, becomes incredibly powerful.
The goal is to identify data points or sequences that are significantly different from the majority of the data.
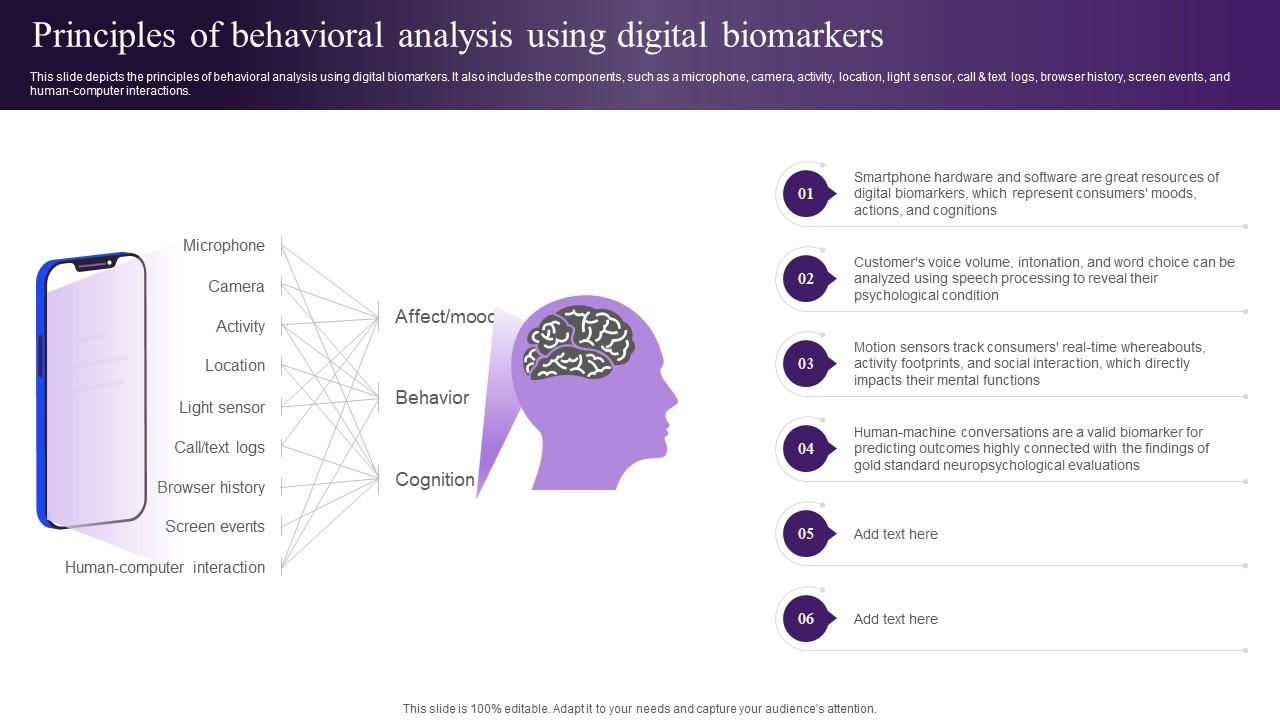
The next video provides a great introduction to anomaly detection in time-series data.
Anomaly detection in time series with Python | Data Science with Marco
This video, "Anomaly detection in time series with Python" by Data Science with Marco, introduces the core concepts and provides practical implementations.
First, watch the introduction from 00:50 to 03:50 to understand what anomaly detection is and the difference between pointwise and pattern-wise anomalies. Then, watch the section on the Isolation Forest algorithm from 20:33 to 27:08. Pay close attention to the intuition: outliers are 'isolated' with fewer partitions in a random tree. This is a very effective and widely used algorithm for this task.
For Neuraease, you could establish a "normal" baseline of movement patterns for a user over several days. Then, you could use an algorithm like Isolation Forest to run in real-time. If a new pattern emerges that the model flags as a high-scoring anomaly (i.e., it's very different from the baseline), that could trigger a 'yellow flag' or a gentle alert, serving as a potential early warning.
Conclusion
Today we bridged the gap between collecting sensor data and extracting meaningful behavioral patterns. We saw that this requires a systematic pipeline of preprocessing and the application of machine learning models.
Key Takeaways:
- Analyzing continuous wearable data requires a data analysis pipeline involving preprocessing, segmentation, and feature selection.
- Supervised learning, like Human Activity Recognition (HAR), is used to classify data into predefined, labeled categories (e.g., 'walking', 'running'). This is useful for identifying known behaviors.
- Unsupervised learning, like anomaly detection, is used to identify novel or unusual patterns that deviate from a baseline, without requiring predefined labels. This is powerful for discovering unexpected changes in behavior.
- Feature selection is a critical step when dealing with high-dimensional sensor data to improve model efficiency and performance.
Preview of the Next Lesson:
We've learned to identify what a person is doing. But the meaning of a behavior often depends on where and when it occurs. Pacing in a gym is exercise; pacing in an office at 10 PM might be stress. In our next lesson, we will explore the role of context-aware computing in interpreting physiological and behavioral data, adding another layer of intelligence to our system.
Can't find a good explanation? Sign up and we'll make it for you
Sign up