
Welcome back. In the previous lesson, you classified fields by their analytical roles: identifiers label records, dimensions provide context, measures quantify activity, and dates anchor analysis in time. Those choices now become practical: a KPI is built from those fields, but it must be defined precisely enough that Excel, SQL, pandas, and Power BI would all produce the same result.
In this lesson, you will learn to define a KPI with four non-negotiable parts: an explicit formula, a unit, an aggregation level, and a time period. We will use a realistic IT service-desk example throughout.
A KPI is a decision-ready definition, not just a number
A metric is any measurable quantity: number of resolved tickets, resolution time, cost, or customer satisfaction score.
A key performance indicator (KPI) is a metric selected to monitor progress toward an objective. It needs enough definition that a stakeholder can answer:
- What exactly is being measured?
- How is it calculated?
- What does the result’s unit mean?
- Which records are included?
- At what level is the result reported?
- Which period does it represent?
- What result counts as acceptable performance?
For example, “SLA breach rate” is only a KPI name. It is not yet a usable KPI definition. Different analysts could calculate it in different ways:
- using opened tickets or resolved tickets;
- including or excluding tickets with no applicable SLA;
- counting rows or distinct tickets;
- using the current assignment group or the group at resolution;
- calculating a calendar month, a fiscal month, or month-to-date.
A report can look polished and still be wrong if these choices are hidden.
How to Develop Key Performance Indicators
Watch “How to Develop Key Performance Indicators” from OnStrategy | Virtual Strategist for a compact overview of the core components of a KPI: measure, target, source, and reporting frequency.
Watch four KPI elements. Focus especially on the insistence that a measure must be described precisely, that the target must use the same kind of unit as the KPI, and that reporting frequency must be feasible from the available data.
The video adds two useful components beyond today’s four required elements: a target and a data source. In workplace reporting, both should normally be documented too. A KPI definition is best treated as a short specification—a shared agreement—rather than an informal label on a dashboard.
The four required parts
A solid KPI definition can be stated in one sentence and then documented in a small specification table.
Consider this operational objective:
Keep incident resolution within agreed service-level commitments.
One appropriate KPI is Monthly SLA Breach Rate.
| Required part | Definition for this KPI |
|---|---|
| Formula | Breached eligible resolved incident tickets ÷ all eligible resolved incident tickets × 100 |
| Unit | Percentage of tickets |
| Aggregation level | One result per assignment group per calendar month |
| Time period | A completed calendar month, based on Resolved_Date |
| Target | At or below 5% |
| Purpose | Identify groups and months where SLA performance needs attention |
Each component removes a different form of ambiguity.
Formula: make the calculation reproducible
An explicit formula tells another analyst exactly how to derive the result. For an assignment group in reporting month :
The formula still needs plain-language definitions of its terms:
- Incident ticket: a record classified as an incident, not a service request or problem record.
- Resolved: the ticket has a populated
Resolved_Dateand has reached the relevant resolved status. - Eligible:
SLA_Applicable = Yesand the breach result is known. - Breached:
SLA_Breached = Yes. - Assignment group: the group responsible at the point of resolution.
- Reporting month: the calendar month containing
Resolved_Date.
This detail is not bureaucracy. It is the difference between a number someone can audit and a number they can only trust.
Because the Resolved_Incidents dataset from earlier lessons has one row per resolved incident ticket, counting rows may currently give the same result as counting distinct Ticket_ID values. Still, writing distinct tickets in the KPI definition protects the calculation if duplicate records appear or if the source later changes to one row per ticket update.
Unit: state what the result represents
The unit tells the reader how to interpret the output.
For the SLA Breach Rate, the unit is percentage of eligible resolved tickets. A displayed value of means:
Of the eligible incident tickets resolved in the defined period and group, 4.8% breached their SLA.
This is different from:
- Breached tickets — a count, measured in tickets.
- Average resolution time — a duration, measured in minutes or hours.
- Ticket cost — a currency amount.
- Tickets per agent — a ratio, measured in tickets per agent.
Be precise with percentage language. SLA breach rate is a proportion within a period, displayed as a percentage. It is usually clearer to say “5% of tickets breached SLA in May” than “5% per month.”
Aggregation level: define one output row
The aggregation level describes what one KPI result represents after source records are summarized. It is sometimes called the reporting grain.
Recall the dataset grain:
One row represents one resolved incident ticket.
The KPI’s aggregation level is different:
One KPI result represents one assignment group in one calendar month.
That means a report table could look like this:
| Reporting month | Assignment group | Eligible resolved tickets | Breached tickets | SLA breach rate |
|---|---|---|---|---|
| May 2025 | Network Support | 160 | 8 | 5.0% |
| May 2025 | Service Desk | 30 | 3 | 10.0% |
| May 2025 | Applications | 90 | 2 | 2.2% |
The KPI calculation aggregates ticket-level rows into group-month results. The two dimensions—Assignment_Group and reporting month—are part of the aggregation level, not incidental labels.
This prevents a frequent reporting error: averaging percentages that already came from groups.
Suppose you need one overall May breach rate for Network Support and Service Desk together. Do not average and :
That wrongly gives equal weight to groups with 160 and 30 tickets. Instead, aggregate the numerator and denominator first:
For any percentage KPI, retain or calculate the underlying numerator and denominator. The percentage alone is not enough for reliable roll-ups.
The time period must use the right date and boundaries
A reporting period is more than a label such as “May.” It specifies:
- Which date field controls inclusion
- The calendar or fiscal convention
- The start and end boundaries
- Whether the period is complete or in progress
For the SLA Breach Rate, the definition should say:
Include eligible incident tickets with
Resolved_Datefrom 1 May 2025 inclusive through 1 June 2025 exclusive.
In logic form:
and
Using an inclusive start and exclusive end prevents problems when a field contains a time as well as a date. A ticket resolved at 23:59 on 31 May is included, while one resolved at 00:00 on 1 June is not.
Match the date to the business question
A ticket may be opened in April and resolved in May. Whether it belongs in May depends on what the KPI claims to measure.
| KPI question | Appropriate date field |
|---|---|
| How many incident tickets arrived? | Opened_Date |
| How many tickets were resolved? | Resolved_Date |
| How long did tickets wait before assignment? | Assigned_Date and Opened_Date |
| How large was the backlog at each month-end? | Snapshot_Date or a carefully defined status-as-of-date calculation |
For the SLA breach KPI above, Resolved_Date is appropriate because the KPI evaluates the outcome of tickets resolved during the month. Using Opened_Date would answer a different question: whether tickets opened in May eventually breached their SLA.
Completed month versus month-to-date
A completed calendar month is stable: the figure for May will not change merely because more tickets arrive in June.
A month-to-date KPI is useful for daily operational monitoring, but its definition must name the cutoff:
SLA breach rate for tickets resolved from 1 May 2025 through 20 May 2025, refreshed at 08:00 on 21 May.
Without an “as of” timestamp, a dashboard user cannot tell whether a lower volume reflects good performance, an incomplete day, or a delayed data refresh.
Understanding Key Performance Indicators (KPIs)
Read the relevant parts of “Understanding Key Performance Indicators” from SimpleKPI. It reinforces the link between a business objective, an explicit calculation, and a reporting frequency that suits the decision being made.
First, in “How to create KPIs in 5 simple steps,” read from the KPI-design process. Focus on the sequence: objective, success criteria, data availability, then formula. Then, in “How to track KPIs,” read the discussion beginning with timing and frequency. Notice that daily monitoring, monthly reporting, and quarterly strategic review can all be valid, but they serve different decisions.
Turn a vague request into a KPI specification
A stakeholder may say:
“Show us which teams are failing SLA.”
That request contains a useful concern but not a defined KPI. A data analyst’s task is to turn it into a specification that can be implemented consistently.
Here is a workplace-ready version.
| Element | KPI specification |
|---|---|
| KPI name | Monthly SLA Breach Rate |
| Business purpose | Monitor whether incident assignment groups meet their service-level commitments |
| Formula | Distinct eligible resolved tickets with SLA_Breached = Yes ÷ distinct eligible resolved tickets × 100 |
| Numerator | Eligible incident tickets resolved in the period that breached SLA |
| Denominator | Eligible incident tickets resolved in the period with a known SLA outcome |
| Unit | Percentage of eligible resolved incident tickets |
| Aggregation level | Assignment group × calendar month |
| Time field | Resolved_Date |
| Time period | Completed calendar month; 1st day inclusive, 1st day of next month exclusive |
| Target / threshold | Green: at or below 5%; amber: above 5% to 8%; red: above 8% |
| Source fields | Ticket_ID, Ticket_Type, Resolved_Date, Assignment_Group_At_Resolution, SLA_Applicable, SLA_Breached |
| Refresh frequency | Daily for the current month; finalised after month end |
| Exclusions | Non-incident records, tickets without an applicable SLA, and records with unknown breach status |
Notice the difference between a KPI definition and a target:
- The definition states what the metric is.
- The target states what outcome is acceptable or desired.
A breach rate of can be calculated correctly even if no target has been set. It becomes performance information when stakeholders agree that, for example, anything above requires attention.
Formula patterns you will use often
Many entry-level analyst KPIs fall into a few patterns. The formula should always be paired with a unit, aggregation level, and period.
| KPI | Formula | Unit | Example aggregation level |
|---|---|---|---|
| Resolved ticket volume | Count of distinct resolved Ticket_ID values | Tickets | Assignment group × week |
| SLA breach rate | Breached eligible tickets ÷ eligible tickets × 100 | Percentage | Assignment group × month |
| Average resolution time | Sum of Resolution_Minutes ÷ number of resolved tickets | Minutes per ticket | Priority × month |
| Backlog at month-end | Count of tickets open at the specified cutoff | Tickets | Assignment group × month-end |
| First-contact resolution rate | Tickets resolved at first contact ÷ eligible resolved tickets × 100 | Percentage | Channel × month |
Two cautions matter:
-
Do not create a rate without defining its denominator.
“Breaches ÷ tickets” is incomplete. Are all tickets included, only resolved tickets, only SLA-applicable tickets, or only tickets with a known SLA outcome? -
Do not use an average when a weighted calculation is required.
Percentages and averages calculated for separate groups often cannot be simply averaged into a total.
From KPI definition to Power BI
Later in the course, you will build DAX measures and interactive Power BI reports. A Power BI KPI visual can display a current value, a trend over time, and a target—but its field settings do not define your business logic for you.
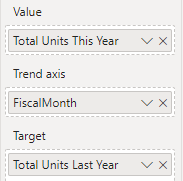
For the service-desk KPI, the eventual Power BI report might use:
- Value: the SLA Breach Rate measure;
- Trend axis: a month field derived from
Resolved_Date; - Target: a 5% threshold or a target measure;
- Breakdown visual:
Assignment_Group.
However, the Power BI visual cannot decide whether to use opened versus resolved tickets, whether to exclude non-applicable SLAs, or whether to count duplicate ticket rows. Those are decisions made in the KPI specification first.
A useful working rule is:
Define the KPI in plain language and mathematics before implementing it in a tool.
That approach also makes validation easier. You can calculate a small sample manually, then later compare the same KPI across Excel, SQL, pandas, and Power BI.
A quick KPI-definition habit
For every KPI you encounter, draft a one-page KPI card before building a chart. Use this compact format:
KPI name:
Business decision supported:

Formula:
Numerator:
Denominator:

Unit:
Aggregation level:
Time field:
Time period and boundaries:

Included records:
Excluded records:
Target or threshold:
Data source and refresh cadence:
For a simple count KPI, the numerator and denominator may not apply. For a percentage, ratio, or average, they are essential.
Keep the wording concrete. “Improve ticket handling” is an objective, not a KPI. “Average resolution time” is a metric name, not a complete KPI. “Average resolution time in hours per resolved P2 incident, by assignment group and completed calendar month, based on resolved date” is approaching an operational definition.
Key takeaways
A reliable KPI is a precisely defined calculation tied to a business decision.
- An explicit formula identifies the calculation, numerator, denominator, filters, and handling of special cases.
- The unit explains the result: tickets, hours, currency, percentage, or another meaningful quantity.
- The aggregation level states what one output result represents, such as one assignment group per month.
- The time period identifies the date field, calendar or fiscal convention, date boundaries, and whether the period is complete or in progress.
- A target indicates what good or poor performance means, but it is separate from the KPI calculation itself.
- For percentage KPIs, calculate totals from the underlying numerator and denominator rather than averaging group percentages.
Next, you will build on these definitions by creating a data dictionary: a practical document that records each field’s meaning, valid values, analytical role, and quality expectations.
Can't find a good explanation? Sign up and we'll make it for you
Sign up