
Hello again. Last lesson established the first safeguard in analysis: identify the grain of the dataset by stating what one row represents. For example, a Resolved_Incidents table might have one row per resolved ticket, while an activity log has one row per ticket update.
Now we will look across the row and classify its fields. This is the next step in making a dataset usable: distinguish the codes that identify records, the attributes that describe them, the quantities that can be calculated, and the fields that locate activity in time. By the end of this lesson, you will be able to classify fields as identifiers, dimensions, measures, or dates and explain the reasoning behind each classification.
Four analytical roles for fields
A spreadsheet column has a data type—text, number, date, or Boolean—but it also has an analytical role. Those are different ideas.
For example, Ticket_ID may be stored as text, while Customer_ID may be stored as a number. Neither is a measure: adding ticket IDs or averaging customer IDs produces nonsense. Their role is to identify business entities.
Use these four categories as your working vocabulary:
| Field role | Main purpose | Typical examples | Main analytical use |
|---|---|---|---|
| Identifier | Uniquely labels or connects a business entity or record | Ticket ID, Customer ID, Product Key, Order Number | Finding records, checking duplicates, joining tables |
| Dimension | Describes, categorizes, filters, or groups data | Assignment Group, Priority, Region, Category, Status | “By priority,” “for each region,” filtering and grouping |
| Measure | Stores a quantity that can be meaningfully summarized | Sales Amount, Quantity, Resolution Minutes, Cost | Sum, average, minimum, maximum, count |
| Date | Represents when an event occurred or the period it belongs to | Opened Date, Resolved Date, Month, Fiscal Year | Trends, period comparisons, time filters |
A useful shorthand is:
Identifiers label. Dimensions describe. Measures quantify. Dates locate activity in time.
The categories are not merely terminology. They determine what you can safely do with the column. If you treat an identifier as a measure, you get meaningless arithmetic. If you treat a date as ordinary text, monthly trends may sort incorrectly. If you summarize a measure at the wrong grain, you can produce a plausible but inaccurate KPI.
What Are Metrics & Dimensions? | BI For Beginners
Watch “What Are Metrics & Dimensions?” by Adam Finer - Learn BI for a concise visual introduction to the distinction between quantitative measures and descriptive dimensions. Its example also reinforces why a numeric-looking ID is not automatically a quantity.
Watch metrics for the definition of a metric and its relationship to aggregation. Then watch dimensions to see how descriptive fields break a metric into meaningful groups. Finish with the spreadsheet example, paying particular attention to why Order ID is not treated as a metric despite consisting of digits.
The video uses “metrics” for what this course calls measures. In workplace reporting, you will hear both terms. A metric often refers to a calculated business result—such as “monthly SLA breach rate”—while a measure can also mean the underlying numeric field used in calculations, such as Resolution_Minutes or Sales_Amount. For now, treat a measure as a field containing a quantity that supports meaningful numerical analysis.
Identifiers: codes, not quantities
An identifier is a field whose values label a particular business object, record, or relationship. It answers “which one?” rather than “how much?” or “which category?”
In a service-desk context, examples include:
Ticket_ID: identifies a ticket.Customer_ID: identifies the customer linked to a ticket.Agent_ID: identifies an agent.Assignment_Group_ID: identifies an assignment group.Update_ID: identifies an individual ticket-history event.
Identifiers are central to data quality and table relationships. In the previous lesson, you learned that the intended grain determines whether an identifier should be unique. In a one-row-per-ticket table, Ticket_ID should generally appear once. In a ticket-update table, Ticket_ID should repeat because many updates can belong to one ticket; in that case, Update_ID may be the unique row identifier.
The “meaningful math” test
A reliable test for numeric fields is:
Does summing, averaging, or otherwise calculating with these values express a meaningful business quantity?
For example:
This result has no business meaning. Customer IDs are codes assigned to customers, not measurements of customers. The same applies to:
- ticket numbers;
- invoice numbers;
- employee IDs;
- postal codes;
- product SKUs;
- system-generated row IDs.
Even when an identifier contains only digits, it remains an identifier.
Identifiers are not always unique in a table
A common beginner mistake is to define an identifier as “a column with no repeated values.” That is too narrow.
Consider this ticket table at one-row-per-ticket grain:
| Ticket ID | Customer ID | Assignment Group | Resolution Minutes |
|---|---|---|---|
| INC-1001 | 20014 | Network Support | 95 |
| INC-1002 | 20014 | Service Desk | 24 |
| INC-1003 | 20087 | Network Support | 180 |
Ticket_ID identifies each row and should be unique. Customer_ID is also an identifier, but it repeats because one customer can submit several tickets.
So distinguish these two questions:
-
Is this field an identifier?
Does it label or connect a business entity? -
Should it be unique at this table’s grain?
Does the grain imply one row per value of this field?
You will apply this distinction later when joining tables in SQL and building Power BI relationships.
Dimensions: the fields that provide context
A dimension is a descriptive field used to categorize, filter, group, or display measures. It gives a number context.
Suppose an analyst reports:
Total resolution time was 12,450 minutes.
That single total is rarely enough to guide action. Add dimensions:
- total resolution time by assignment group;
- average resolution time by priority;
- ticket count by category;
- SLA breach rate by region.
The measure has not changed. The dimension determines how the measure is split.
For a resolved-ticket dataset, these are likely dimensions:
| Field | Why it is a dimension |
|---|---|
Assignment_Group | Categorizes responsibility for a ticket |
Priority | Describes urgency, such as P1, P2, or P3 |
Category | Describes the type of issue |
Status | Describes the ticket’s current or final state |
Channel | Describes how the ticket was submitted |
Customer_Segment | Groups customers into business categories |
Region | Describes customer or operational location |
Dimensions are often text, but text is not a requirement. A numeric field can be a dimension when it is a coded label rather than a quantity. Examples include:
Postal_CodePriority_CodeStore_NumberFiscal_YearMonth_Number
A Boolean field can also act as a dimension. For example, SLA_Breached with values Yes and No can filter tickets into two groups.
Dimensions help you ask “by what?”
When you encounter a likely measure, pair it with the phrase “by what?”
| Business question | Measure | Dimension |
|---|---|---|
| How many resolved tickets were there by group? | Ticket count | Assignment Group |
| What was average resolution time by priority? | Average Resolution Minutes | Priority |
| Which regions generated the most tickets? | Ticket count | Region |
| How did ticket volume differ by category? | Ticket count | Category |
This pattern will soon become familiar in Excel PivotTables, SQL GROUP BY queries, pandas groupby, and Power BI visuals.
Measures: quantities with meaningful aggregation
A measure is a numeric quantity that can be summarized meaningfully. Typical operations include:
- sum;
- average;
- minimum;
- maximum;
- count;
- median.
Common service-desk measures include:
| Field | Likely useful aggregation | Meaning |
|---|---|---|
Resolution_Minutes | Average, median, minimum, maximum | Time taken to resolve tickets |
Work_Hours | Sum, average | Recorded effort |
Ticket_Cost | Sum, average | Cost associated with a ticket |
Reopen_Count | Sum, average | Number of times a ticket was reopened |
Satisfaction_Score | Average, distribution | Customer rating |
Tickets_Resolved | Sum | Volume in an already summarized table |
The word meaningfully matters. Not every measure should be summed.
For example, individual ticket resolution times can be summed, but the result is a total elapsed duration across tickets—not necessarily the amount of agent labor, because multiple people or systems may have been involved and ticket durations can overlap. More commonly, you would report the average or median resolution time.
Similarly, a pre-calculated SLA_Breach_Rate is a measure, but you should not automatically average rates across groups. The correct combined rate normally uses the underlying numerator and denominator:
If Group A resolved 20 tickets with a 20% breach rate and Group B resolved 200 tickets with a 5% breach rate, the overall result is not simply:
It must weight each rate by ticket volume:
This is why analysts prefer storing or obtaining counts such as Breached_Tickets and Resolved_Tickets, rather than relying only on pre-calculated percentages.
Flags can play two roles
Some fields are context-dependent. Suppose SLA_Breached is stored as Yes or No.
- As a field you filter or group by, it acts as a dimension.
- If it is stored as
1for breached and0for not breached, summing it counts breached tickets—so it can function as a measure.
For field documentation, choose the primary role relevant to your analysis and note the calculation rule. If your team uses SLA_Breached to segment tickets, document it as a dimension. If it uses SLA_Breach_Flag to calculate counts, document it as a measure.
Dates: a separate analytical role
A date field tells you when something happened, when it was recorded, or which reporting period it belongs to.
In an incident table, several dates may coexist:
| Field | Meaning | Typical use |
|---|---|---|
Opened_Date | When the ticket was created | Volume trend by opening period |
Assigned_Date | When ownership was assigned | Queue-delay analysis |
Resolved_Date | When resolution occurred | Resolved volume and SLA reporting |
Closed_Date | When the ticket was formally closed | Closure-process reporting |
Snapshot_Date | Date on which a system state was captured | Backlog trend reporting |
Do not assume fields called “date” are interchangeable. A ticket opened in April and resolved in May belongs to different reporting periods depending on the question.
For the stakeholder question introduced in the previous lesson—
For resolved incident tickets in May 2025, which assignment group had the highest SLA-breach rate?
—the relevant date is probably Resolved_Date, not Opened_Date. The time field must match the KPI definition.
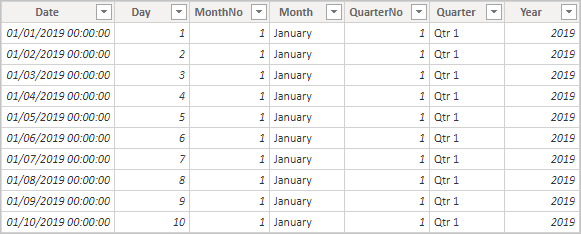
A date table often contains derived calendar fields such as Year, Quarter, Month, and MonthNo. In everyday conversation, these may be called dimensions because they group data. For the classification system in this course, record them as date-related fields because their core purpose is time-based analysis.
Be careful with Month alone. A value such as January is not enough to distinguish January 2024 from January 2025. For trend reporting, pair it with a year, use a complete date, or use a sortable period field such as 2025-01.
Numeric date keys are still dates
Some source systems use values such as 20250531 instead of a standard date. Although this value looks numeric, it represents 31 May 2025. Its analytical role is a date key, not a measure. You would never sum all date keys.
This reinforces a central rule:
Classify a field by its business meaning, not by how it happens to be stored.
A date saved as text needs conversion before analysis. An ID saved as a number remains an identifier. A postcode saved as a number remains a descriptive code.
A practical classification workflow
When you open a new dataset, classify fields after identifying its grain. Work through this sequence:
-
Read the field name and inspect example values.
Names such asTicket_ID,Opened_At,Resolution_Minutes, andAssignment_Groupprovide clues. Samples confirm whether the name is trustworthy. -
Check whether it identifies or connects something.
If it is a record code, entity code, or foreign key, classify it as an identifier. -
Check whether it represents time.
If it records a date, timestamp, month, quarter, year, or reporting period, classify it as a date or date-related field. -
Apply the meaningful-math test.
If sum, average, minimum, maximum, or another aggregation has a valid interpretation, classify it as a measure. -
Otherwise, ask whether it describes or groups records.
A field used to filter, categorize, or break down results is a dimension.
This decision order avoids a common error: calling every numeric field a measure.
The workflow is a guide, not an excuse to ignore context. Agent_ID in a ticket table is an identifier even though it may appear in grouping. MonthNo is numeric but supports calendar ordering rather than quantity calculation. A Breach_Flag can be a dimension or measure depending on its representation and intended use.
Classifying a realistic ticket dataset
Assume a table called Resolved_Incidents has this grain:
Each row represents one resolved incident ticket.
Here is a practical field classification.
| Field | Example | Primary role | Reason |
|---|---|---|---|
Ticket_ID | INC-10428 | Identifier | Labels the ticket; should be unique at ticket grain |
Customer_ID | 20014 | Identifier | Connects the ticket to a customer; may repeat |
Assignment_Group | Network Support | Dimension | Describes ownership and supports grouping |
Priority | P2 | Dimension | Categorizes urgency |
Category | VPN Access | Dimension | Describes issue type |
Opened_Date | 2025-05-03 | Date | Identifies when the ticket was created |
Resolved_Date | 2025-05-05 | Date | Identifies when it was resolved |
Resolution_Minutes | 2,880 | Measure | Supports average, median, and distribution analysis |
SLA_Breached | Yes | Dimension | Supports filtering or grouping by breach status |
SLA_Breach_Flag | 1 | Measure | Can be summed to count breached tickets |
Customer_Region | North | Dimension | Describes customer location |
Resolution_Code | Solved by reset | Dimension | Categorizes the resolution outcome |
Notice that Customer_ID is an identifier but does not need to be the row key. This table’s key is Ticket_ID. In a separate customer table, the same Customer_ID would probably be the primary identifier for that table.
How these roles appear in a Power BI model
Power BI models are built around the same logic. A fact table records events or observations, while dimension tables provide the descriptive context for those events.
Understand star schema and the importance for Power BI
Read Microsoft’s Power BI guidance to connect today’s field classifications to the data models you will create later. Focus on how dimension tables provide descriptive attributes, fact tables hold observations and numeric values, and keys make relationships possible.
In the “Star schema overview” section, read the dimension-table explanation, focusing on keys versus fields used for filtering and grouping. Continue in the “Fact tables” subsection with the fact-table explanation, especially the relationship between dimension keys, numeric measure columns, and granularity. Then read the “Measures” section from the definition and examples. Finally, in “Surrogate keys,” read the surrogate-key overview to see why unique identifiers matter in a model.
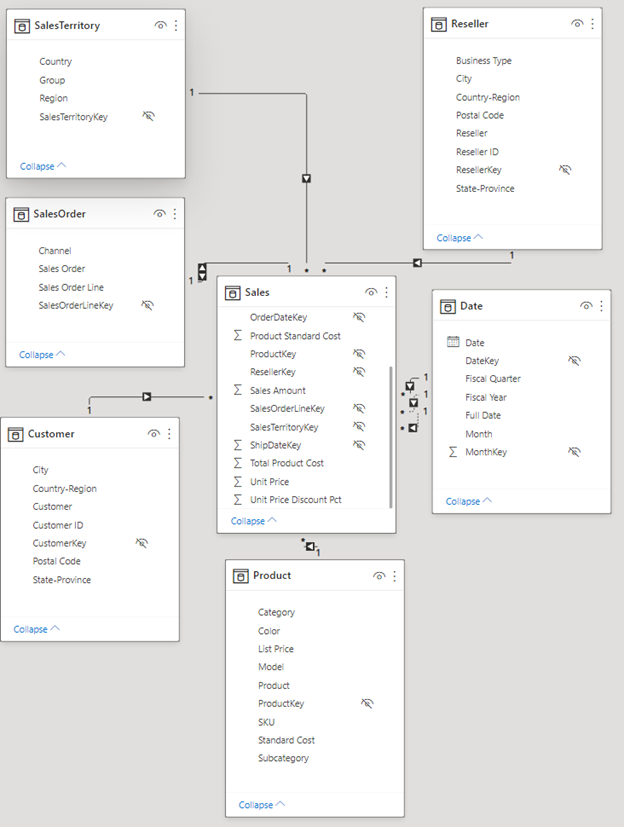
In the model shown above:
Sales Amount,Unit Price, andTotal Product Costin the central Sales table are measures.ProductKey,ResellerKey, andSalesTerritoryKeyare identifiers used to connect the Sales table to related tables.- Product fields such as
Category,Color, andSubcategoryare dimensions. - Date fields such as
Date,Fiscal Quarter, andFiscal Yearprovide time context.
You may notice that Power BI also uses the word measure for a DAX formula, such as:
That is an explicit DAX measure, which you will build later in the course. Today’s focus is the underlying classification of source fields. Sales Amount is a numeric measure column; Total Sales is a calculated measure based on that column.
Record classifications in your data dictionary
A data dictionary should capture not only a field’s data type, but also its analytical role and expected use. Start using a structure like this:
| Field | Example value | Role | Definition | Valid analysis note |
|---|---|---|---|---|
Ticket_ID | INC-10428 | Identifier | Unique incident ticket code | Count distinct when ticket grain is uncertain |
Assignment_Group | Network Support | Dimension | Team responsible for resolving the ticket | Group and filter ticket metrics |
Resolved_Date | 2025-05-05 | Date | Date the ticket reached resolved status | Use for resolved-ticket monthly reporting |
Resolution_Minutes | 2,880 | Measure | Elapsed minutes from opening to resolution | Average or median is usually more interpretable than total |
SLA_Breach_Flag | 1 | Measure | 1 if the ticket breached SLA; otherwise 0 | Sum to count breached tickets |
This documentation makes your reasoning visible. It also reduces errors when the dataset is later used in Excel formulas, SQL queries, pandas code, or a Power BI report.
A short hands-on habit
When you next receive a non-sensitive spreadsheet or CSV export, create a new worksheet named Field_Classification. List each source field, add a Role column, and classify each as identifier, dimension, measure, or date. For every numeric field, write one brief note answering: “What would the sum or average of this field mean?” If you cannot answer that clearly, it is probably not a measure.
Key takeaways
A field’s analytical role is determined by its business meaning and intended use, not merely by whether it contains text or numbers.
- Identifiers label records or entities and support duplicate checks and relationships. They are not quantities to sum.
- Dimensions describe records and let you group, filter, and compare results.
- Measures are quantities that support meaningful aggregation, though the correct aggregation depends on the measure and dataset grain.
- Dates identify when activity occurred and enable trend and period analysis.
- Numeric values are not automatically measures: IDs, postcodes, codes, and date keys are common exceptions.
- A field can sometimes serve more than one purpose, so document its primary role for the analysis at hand.
Next, you will use these classifications to define a KPI precisely: its formula, unit, aggregation level, and time period.
Can't find a good explanation? Sign up and we'll make it for you
Sign up