
Hello. In the previous lesson, you moved from a transfer function to the complex frequency response by substituting . For example, the RC low-pass response at one frequency was found to be
That complex number contains two distinct pieces of information: how much the signal amplitude changes, and how much its phase changes. This lesson extracts the first piece: magnitude, then expresses it on the logarithmic decibel scale used in filter plots.
By the end, you should be able to calculate , convert it to gain in dB, and interpret what that value says about the output sinusoid’s amplitude.
Magnitude: the amplitude part of a complex response
For a sinusoidal input at angular frequency ,
Taking magnitudes on both sides gives
Therefore,
The magnitude of the frequency response is a nonnegative, dimensionless voltage-amplitude ratio.
- : output and input have equal amplitudes.
- : the output is attenuated.
- : output amplitude exceeds input amplitude.
- : no output remains at that frequency.
Use the same amplitude convention for input and output: both peak values, both RMS values, or both peak-to-peak values. Since the ratio is taken, the convention cancels out.
If a frequency response has rectangular form
then its magnitude is found using the complex-number modulus:
Here and are real numbers. The sign of does not affect the magnitude, because it is squared.
For a quotient of complex expressions,
use the useful property
This often avoids unnecessary complex-conjugate algebra.
Transfer Function from Circuit and creating its Bode Plots
Watch Transfer Function from Circuit and creating its Bode Plots from University of Utah professor Angela Rasmussen. It gives a compact demonstration of taking the magnitude of a complex frequency response and then converting that result to decibels.
Watch complex magnitude to review how the modulus of a+jb is calculated and how magnitudes distribute across products. Then watch dB conversion for the transition from an ordinary amplitude ratio to a Bode-magnitude value.
Worked example: magnitude of the response from the previous lesson
Continue with the RC low-pass result already obtained:
Apply the modulus formula:
The interpretation is direct: at , the output amplitude is times the input amplitude. For a RMS input, for example, the output magnitude would be
Notice that we have deliberately not calculated the phase angle. The magnitude tells us the vertical coordinate on a magnitude plot; phase will be handled in the next lesson.
Direct magnitude calculation for an RC low-pass expression
For the standard RC low-pass response, with output taken across the capacitor,
the numerator has magnitude . The denominator has real part and imaginary part , so its magnitude is
Thus,
This is an important pattern: calculate the magnitude of the numerator and denominator separately, then divide.
At the frequency used in the previous lesson,
and
so
Hence,
This agrees with the magnitude found from . Both routes are valid:
- convert the completed response to rectangular form, then take its modulus;
- take numerator and denominator magnitudes directly.
The second method is usually quicker when the response is already in factored or quotient form.
From an amplitude ratio to decibels
A raw magnitude such as is physically meaningful, but it becomes inconvenient when a filter must be described over frequencies ranging from a few hertz to megahertz. Decibels compress these ratios into a practical scale.
For a voltage or current amplitude ratio, define gain in decibels as
The factor , rather than , is used because power is proportional to the square of voltage when the relevant impedances are the same. A power ratio would instead use
For filter voltage responses, use the first formula: .
Returning to the example,
Therefore,
A gain of means a modest reduction in output amplitude. It does not mean that the output voltage is negative, nor that the output is zero.
These values are worth recognizing immediately:
| Magnitude ratio | Gain in dB | Meaning |
|---|---|---|
| Amplitude doubled | ||
| No amplitude change | ||
| Half-power point | ||
| Amplitude halved | ||
| Amplitude reduced to one tenth |
The row will become especially important in the next lessons, because it defines the conventional cutoff point of many passive filters.
To reverse a dB calculation and recover the ordinary magnitude ratio, use
For instance, a response value of corresponds to
Reading Bode magnitude plots
A Bode magnitude plot displays frequency on the horizontal axis, usually logarithmically, and on the vertical axis. Each point gives the output-to-input amplitude ratio at that frequency, expressed in dB.
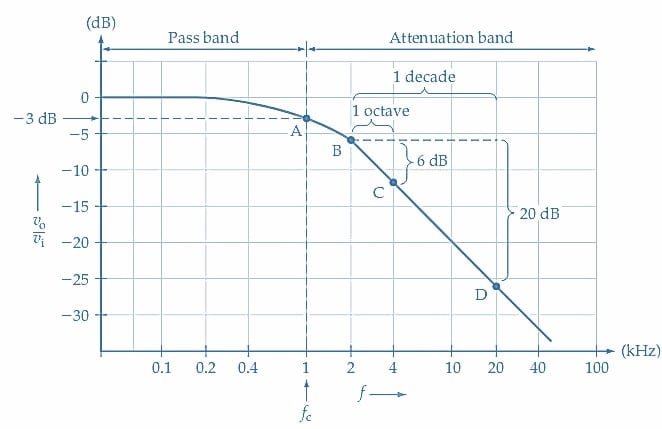
On the plotted low-pass response:
- Near , is close to , so low-frequency signals retain nearly their full amplitude.
- At , .
- At , .
- More negative dB values mean stronger attenuation.
The logarithmic frequency axis helps display many decades of frequency, while the dB axis makes multiplicative changes in amplitude easy to compare. The detailed asymptotic construction of the per decade line comes later; for now, focus on treating any point on the curve as a magnitude ratio written in dB.
What Is a Low Pass Filter? A Tutorial on the Basics of Passive RC Filters
Read the “Visualizing Filter Response” section from All About Circuits. It connects the numerical magnitude calculations in this lesson to the dB scale and the way a filter response is plotted across a broad frequency range.
In the subsection “Visualizing Filter Response,” begin with the curve interpretation. Focus on how a -20\ \text{dB} value corresponds to an output magnitude of 0.1 for a 1\ \text{V} input, and on why a logarithmic frequency axis is useful.
A dependable calculation routine
When asked for the magnitude gain and dB gain at a specified frequency, use this sequence:
-
Convert the stated frequency to angular frequency if necessary:
-
Evaluate the response at that frequency:
-
Calculate the ordinary magnitude. For rectangular form, use
For a quotient, take numerator and denominator magnitudes separately.
-
Convert the magnitude to decibels:
-
State both forms in words. For example: “The gain is , or ; the output amplitude is about of the input amplitude.”
Two errors account for many incorrect results:
- Applying to a complex number rather than to its magnitude.
- Treating a dB value as a voltage. A value such as is a logarithmic ratio, not .
Key takeaways
The magnitude of a frequency response is the amplitude ratio
For a complex number ,
and for a quotient, calculate the numerator and denominator magnitudes separately.
Express the result in decibels with
A magnitude of corresponds to ; magnitudes below produce negative dB values and indicate attenuation. In particular, corresponds to approximately .
Next, you will calculate the phase angle , completing the two-part interpretation of a complex frequency response.
Can't find a good explanation? Sign up and we'll make it for you
Sign up