
Hello again. In the previous lesson, you calculated the magnitude of a complex frequency response and expressed it in decibels. For the RC low-pass example,
had magnitude , meaning that the output amplitude was of the input amplitude at that frequency.
That same complex response also tells us the output’s phase shift relative to the input. In this lesson, you will calculate , interpret positive and negative phase angles, and read phase from a Bode plot. By the end, you should be able to state both what the angle is and whether the output leads or lags the input.
Phase: the timing relationship contained in
A sinusoidal input and output at one frequency can be represented by phasors:
Taking the angle of both sides gives
Therefore,
The phase of the frequency response is the output phase relative to the input phase.
- A positive phase angle means the output leads the input.
- A negative phase angle means the output lags the input.
- A phase angle of means the two sinusoids are in phase.
For example, suppose
and the filter response at that frequency is
Then the output is
or
The filter has changed both properties of the sinusoid:
- Its amplitude has fallen from to .
- Its waveform occurs later in its cycle than the input waveform.
Phase is frequency-dependent. A circuit can introduce a small lag at one frequency and a much larger lag at another; it is not generally a single fixed time delay for every sinusoidal component.
In First Order Lowpass RC Filter, Mateo Aboy separates a complex response into its magnitude and phase components and derives the phase expression for the standard RC low-pass filter.
Watch magnitude and phase. Focus especially on the explanation beginning around 00{:}05{:}15: the phase of a quotient is the numerator phase minus the denominator phase, which is the most efficient method for many filter calculations.
Calculating the angle of a complex frequency response
If a completed frequency response is in rectangular form,
then its phase is the angle of the vector with horizontal coordinate and vertical coordinate :
The notation means “choose the angle using both the real and imaginary signs.” It is safer than blindly evaluating , because an ordinary inverse tangent by itself cannot distinguish all four quadrants.
For first-order passive filters, you will often encounter simple quadrants:
| Form of | Real part | Imaginary part | Phase range |
|---|---|---|---|
| , with | positive | positive | to |
| , with | positive | negative | to |
| , with | negative | positive | to |
| , with | negative | negative | to |
A calculator’s atan2 function may be written as atan2(imaginary, real). Ensure that it is set to degree mode if the required answer is in degrees.
The factor-by-factor method
Filters are commonly expressed as quotients:
Rather than first converting the entire expression to rectangular form, calculate the numerator and denominator angles separately:
This follows directly from division of phasors. Likewise, phases add when complex factors are multiplied:
For a factor of the form
with , its angle is
For a factor of the form
with , its angle is negative:
Keeping the signs visible before entering anything into a calculator is a reliable habit.
Worked example: phase of the previous RC response
The previous lesson obtained
The real part is positive and the imaginary part is negative, so the response lies in the fourth quadrant. Its phase must be negative.
Thus, at
the output of this RC low-pass filter lags the input by approximately
The same result can be obtained more efficiently from the standard RC low-pass response:
The numerator has zero phase:
The denominator has real part and imaginary part , so its phase is
Because the denominator’s phase is subtracted,
For the earlier component values,
and
so
Therefore,
Both methods agree, as they must.
An equivalent form uses the cutoff angular frequency:
Thus,
Since
you may also calculate phase directly from frequencies in hertz:
provided that and use the same unit.
What the RC low-pass phase formula tells you physically
Consider the standard RC low-pass phase response:
At very low frequency,
so the ratio is close to zero. Hence,
This fits the circuit behavior: at low frequency, the capacitor’s impedance is large, the output across the capacitor is nearly equal to the input, and there is almost no phase shift.
At the cutoff frequency,
so
At frequencies far above cutoff,
the arctangent approaches , giving
The output across the capacitor increasingly lags the input.
A few exact-response values are useful reference points:
| Frequency | Phase of RC low-pass response |
|---|---|
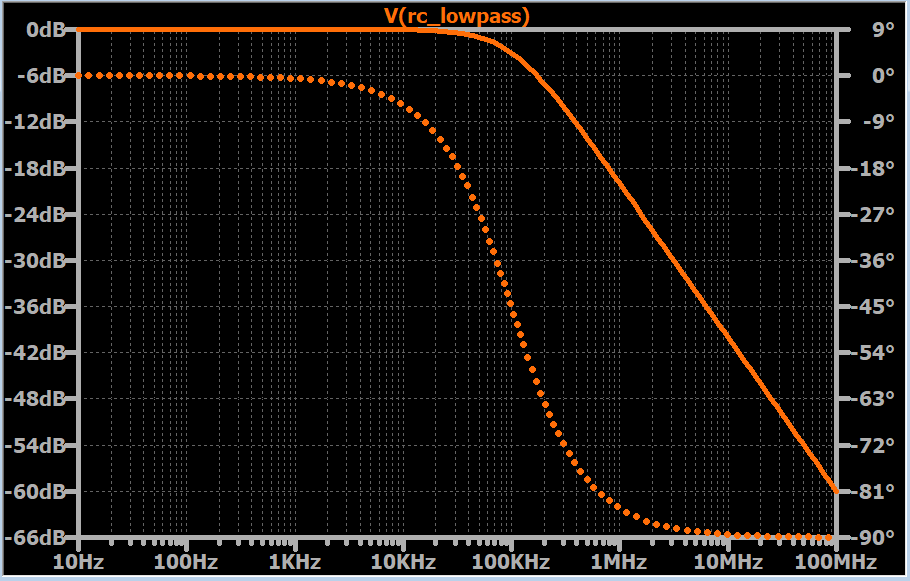
A Bode phase plot places frequency on a logarithmic horizontal axis, just as a Bode magnitude plot does. The vertical axis reports phase in degrees. At any chosen frequency, the magnitude plot answers “how much amplitude remains?” while the phase plot answers “how far does the output lead or lag?”
A dependable phase-calculation routine
When asked to calculate phase at a specified frequency, use the following procedure.
-
Convert frequency if necessary. If values are given in hertz but the response uses angular frequency, calculate
-
Substitute the specified frequency into the response to obtain .
-
Choose an efficient form.
- If the response is already rectangular, identify its real and imaginary parts.
- If it is a quotient or product of simple factors, find each factor’s angle and combine them.
-
Calculate the phase. For rectangular form, use
For quotient form, use
-
Interpret the sign.
- Negative angle: output lags.
- Positive angle: output leads.
-
State the result with a frequency and unit. For example: “At , the phase is ; the output lags the input by .”
Two common mistakes are worth avoiding:
- Using the magnitude formula when the question asks for phase.
- Reporting without checking the signs of and . The signs determine the correct quadrant.
Key takeaways
The phase angle of a frequency response is the output phase relative to the input:
For rectangular form,
use
For a quotient, calculate phase efficiently by subtraction:
For a standard RC low-pass filter,
the phase response is
It is near at low frequency, exactly at cutoff, and approaches at high frequency.
Next, you will connect the familiar magnitude value to half power, and see why the cutoff point has magnitude .
Can't find a good explanation? Sign up and we'll make it for you
Sign up