
Hello again. In the previous lesson, you learned how ownership and permissions determine whether a user or service can read files, write logs, or execute scripts. When a machine becomes slow or an application misbehaves, permissions answer who is allowed to act; process inspection answers what is actually running and what resources it is consuming.
In this lesson, you will learn a cautious troubleshooting routine: inspect CPU, memory, swap, and disk capacity; identify a specific process by its PID and command; then stop only a controlled test process, beginning with a graceful request and escalating only when necessary. This is the same basic workflow used when a training job, data-preprocessing task, inference server, or runaway script affects a Linux host. Plan for about 40 minutes.
A process is the running form of a program
A program is a file on disk, such as python, bash, or a model-serving executable. A process is one running instance of that program, with its own identity and allocated resources.
Every process has a PID (process identifier), which is unique while that process exists. It also usually has:
- a PPID: the parent process’s PID.
- An owning user: the account under which it runs.
- A state, such as running or sleeping.
- CPU time and memory consumption.
- The command line that launched it.
This distinction matters in AI infrastructure. You may deliberately run several Python processes: a notebook, a preprocessing worker, an API service, and a training task. Seeing python use CPU is not enough evidence to stop it. You need to establish which instance, who owns it, what command started it, and whether its behavior is expected.
High resource use is not automatically a malfunction:
- High CPU can be normal during tokenization, feature engineering, compilation, or CPU-based model training.
- High memory can be normal while loading a large dataset or model.
- Sustained swap use, unexpectedly growing memory use, or a process consuming resources after its expected work finished is more suspicious.
- A process that repeatedly reappears after you stop it may be managed by a service supervisor. Repeatedly killing it is not a fix; first identify what is launching it.
Take a compact system snapshot
When a system feels slow, begin with the overall picture before focusing on an individual process.
uptime
nproc
free -h
df -h ~
Here is what to look for:
| Command | What it shows | Initial interpretation |
|---|---|---|
uptime | Uptime and 1-, 5-, and 15-minute load averages | Compare sustained load with the number from nproc. |
nproc | Number of available logical CPU cores | Gives context for load and CPU demand. |
free -h | RAM, available memory, and swap | Pay particular attention to available memory and active swap. |
df -h ~ | Space available on the filesystem containing your home directory | Useful for logs, datasets, checkpoints, and artifacts filling a disk. |
Load average: a useful warning, not a verdict
Linux reports three load averages: demand over the last 1, 5, and 15 minutes. A rough first comparison is against the logical CPU count from nproc.
For example, if nproc reports 4, a sustained load around or above 4 deserves investigation. But do not treat this as a precise percentage: Linux load also includes some tasks waiting in uninterruptible I/O, such as slow disk operations. Use it as a sign to inspect further, not as proof that the CPU alone is at fault.
Memory and swap
Linux uses spare RAM for filesystem cache. Therefore, “used memory” by itself can be misleading: cached memory can be reclaimed when applications need it. In free -h, the available column is usually a more useful quick indicator of how much memory can be allocated without substantial pressure.
Swap is disk-backed memory and is much slower than RAM. A small amount of swap is not necessarily an emergency, but steadily increasing swap use alongside poor responsiveness often points to memory pressure.
For this course, these commands cover host CPU and ordinary system memory. GPU utilization and accelerator memory have their own monitoring tools, which you will examine later in the course.
Watch the system live with top
top is an interactive, continuously refreshing process monitor. It is especially valuable because it is commonly installed even on minimal Linux servers.
Start it with:
top
Use these keys while top is open:
| Key | Action |
|---|---|
q | Quit |
P | Sort process list by CPU use |
M | Sort process list by memory use |
1 | Toggle combined versus per-core CPU display |
d | Change refresh interval |
h | Show help |
k | Prompt to send a signal to a specified PID |
The upper portion is the system summary. The lower portion is the process list.
Demystifying the top Command in Linux | Linux Crash Course Series
Learn Linux TV’s “Demystifying the top Command in Linux” gives a visual walkthrough of the parts of top most useful during first-line troubleshooting: memory and swap, the process list, sorting, and stopping a process.
Start with memory and swap to see why cache is not the same as unusable RAM and why substantial swap activity can signal memory pressure. Continue with process columns, focusing on PID, RES, %CPU, %MEM, and COMMAND, plus the P and M sort keys. Finish with the kill prompt for the mechanics of sending a signal from inside top; in the lab below, you will use the external kill command instead because it makes verification easier.
Read the process list deliberately
A typical top process row includes these fields:
| Field | Meaning | Why it matters now |
|---|---|---|
PID | Process identifier | The exact target for inspection or signaling |
USER | Account that owns the process | Explains whether you are allowed to stop it |
S | Process state | R is running; S is sleeping; Z is a zombie |
RES | Resident physical memory in RAM | More useful than virtual memory for immediate RAM pressure |
%CPU | Recent CPU use | Find processes actively consuming compute |
%MEM | Percentage of physical RAM used | Identify memory-heavy processes |
TIME+ | Cumulative CPU time since start | Distinguishes a brief spike from long-running computation |
COMMAND | Program or command that launched it | Essential context before acting |
When diagnosing a slow machine, sort by CPU first with P. If CPU use is modest but memory is scarce or swap is active, sort by memory with M.
Do not immediately stop the first process at the top of the list. First inspect its identity. A legitimate training job may be exactly what you expect to see; a forgotten infinite loop may not be.
Use ps to identify one exact process
Unlike top, which refreshes continuously, ps gives a snapshot. It is excellent for producing a precise, copyable report about one process.
A useful system-wide view, sorted by current CPU usage, is:
ps -eo pid,ppid,user,stat,%cpu,%mem,etime,cmd --sort=-%cpu | head -n 12
To see the biggest memory users instead:
ps -eo pid,ppid,user,stat,%cpu,%mem,etime,cmd --sort=-%mem | head -n 12
Once you have a candidate PID, inspect only that process:
ps -p PID -o pid,ppid,user,stat,%cpu,%mem,etime,cmd
Replace PID with an actual number. For example, if the PID is 4821:
ps -p 4821 -o pid,ppid,user,stat,%cpu,%mem,etime,cmd
This is safer than relying on a short process name. A machine may have several processes all named python, but their command lines, owners, elapsed times, and parents can reveal very different roles.
The following reference reinforces the distinction between a snapshot and a live monitor, then introduces signals for process shutdown.
Viewing and Monitoring Processes in Linux - Tutorials
Ubuntu’s “Viewing and Monitoring Processes in Linux” provides a concise reference for ps, process identifiers, and termination signals. Read it to connect the commands in this lesson to the underlying process model.
In Section 2, “List and Identify Processes,” begin at the paragraph starting the ps overview. Note the meanings of PID, CPU time, and command, then scan the ps aux examples as an alternative broad process listing. Next, go to Section 5, “Start and Stop Processes,” under “The Kill command.” Read the signal guidance, concentrating on the difference between the default termination signal and the last-resort forced termination signal.
A process can also be located by searching its full command line:
pgrep -af 'python'
The -a option prints the command line; -f matches against the full command line rather than only the short executable name. Treat this as a discovery tool, then use ps -p on the exact PID before sending any signal.
A safe termination workflow
Stopping a process is not just “run kill.” The command sends a signal—a message delivered by the kernel to the target process. The word “kill” is historical; the signal may request a controlled shutdown rather than instantly destroy the process.
Use this sequence:
- Observe the symptom. Is CPU, memory, swap, disk, or responsiveness the actual concern?
- Identify the precise process. Inspect PID, user, command, elapsed time, and parent where relevant.
- Use the normal shutdown path if available. For a foreground terminal program, this may be
Ctrl-C. An application may have its own documented shutdown command. - Send
SIGTERMfirst. This asks the process to shut down. A well-designed application can close files, flush data, and release resources. - Verify. Check whether the PID has disappeared and whether system resource use changed.
- Escalate to
SIGKILLonly after confirmation. This forcibly ends the process and gives the application no opportunity to clean up.
The two signals you need today are:
| Signal | Command | Meaning |
|---|---|---|
SIGTERM (15) | kill -TERM PID or simply kill PID | Graceful request to terminate; the default for kill |
SIGKILL (9) | kill -KILL PID or kill -9 PID | Immediate forced termination; use only when SIGTERM fails |
SIGTERM can be handled or ignored by an application. SIGKILL cannot be caught, ignored, or delayed. That is why SIGKILL may leave incomplete output files, corrupted checkpoints, or partially written logs.
Also observe these boundaries:
- You can normally signal processes owned by your user account.
- Stopping another user’s process usually requires administrative privileges.
- Administrative privilege does not make a target safe. Never use
sudo killmerely to bypass an “Operation not permitted” error. - Do not experiment on
systemd(PID 1), desktop-session components, unknown services, or processes you did not start.
Hands-on lab: create, inspect, and stop a controlled CPU hog
You will now create a deliberately wasteful process in your lab directory. It does no useful work: it loops forever and occupies CPU time. Run this only when you can spare one CPU core for a minute or two; it may make a low-powered computer temporarily less responsive.
Create the test script:
mkdir -p ~/ai-infra-lab/processes
cd ~/ai-infra-lab/processes

printf '%s\n' \
'#!/usr/bin/env bash' \
'while :; do :; done' \
> cpu-hog.sh

chmod u+x cpu-hog.sh
The : command is a shell no-op. The loop runs it endlessly without printing output or filling disk space.
Start it at a lower scheduler priority with nice. This does not cap its CPU usage, but it tells Linux that other runnable work should generally take precedence.
nice -n 10 ./cpu-hog.sh &
HOG_PID=$!

printf 'CPU hog PID: %s\n' "$HOG_PID"
jobs -l
The & runs the command in the background. Immediately afterward, the special shell variable $! contains the PID of the most recently started background process. Saving it as HOG_PID avoids guessing.
Inspect the process directly:
ps -p "$HOG_PID" -o pid,ppid,user,stat,%cpu,%mem,etime,cmd
Now monitor only that PID live:
top -p "$HOG_PID"
You should see the test process consuming substantial CPU. On a multi-core machine, overall CPU use may still look modest because only one logical core is busy. Press q to leave top.
Before stopping it, confirm once more that the PID and command still match the script you created:
ps -p "$HOG_PID" -o pid,ppid,user,stat,%cpu,%mem,etime,cmd
Then request a graceful shutdown:
kill -TERM "$HOG_PID"
sleep 1

ps -p "$HOG_PID" -o pid,ppid,user,stat,%cpu,%mem,etime,cmd
For this simple script, SIGTERM should end it promptly. If the final ps command prints only its header—or no process row—the PID is gone. You can also check the shell’s background-job report:
jobs -l
In a real incident, wait a reasonable amount of time based on the workload. A process saving a large model checkpoint may need longer than a simple shell script.
If—and only if—the controlled test process were still present after confirming its PID and command, the escalation would be:
kill -KILL "$HOG_PID"
Verify again with ps. Then remove the test script:
rm cpu-hog.sh
This lab demonstrates the complete operational cycle: create a known workload, observe it, identify it by PID, request graceful termination, and verify the outcome.
htop: a friendlier optional interface
top is the baseline tool to learn because it is widely available. If htop is already installed on your computer, you can start it with:
htop
It presents the same general information with easier navigation, visible CPU and memory meters, and a selectable process list.
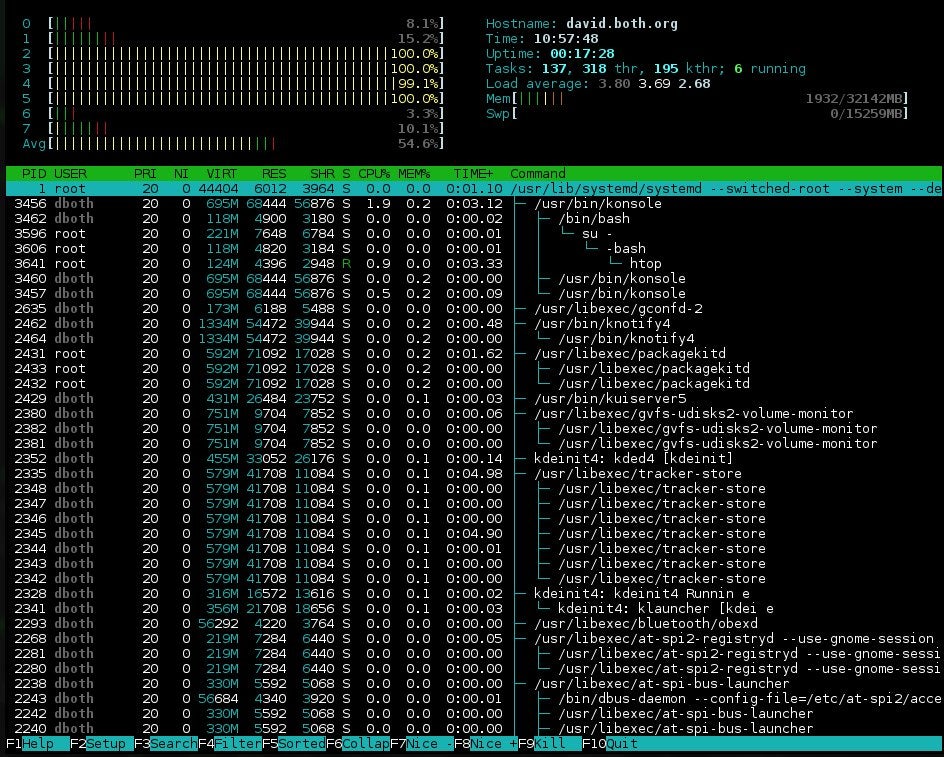
In htop:
- Use the arrow keys to select a process.
- Press
F6to choose a sort field such as CPU or memory. - Press
F5to switch to a process-tree view. - Press
F9to choose and send a signal to the selected process. - Press
F10to quit.
The visual interface can make investigation faster, especially when there are many processes. But retain the same safety discipline: inspect the command and PID, prefer SIGTERM, and verify the result. A clearer interface does not make an uncertain target safe.
Key takeaways
- Use
uptime,nproc,free -h, anddf -hto establish whether CPU demand, memory pressure, swap, or storage capacity may be involved. topprovides a live view;Psorts by CPU,Msorts by memory, andqexits.psgives a precise snapshot. Before acting, inspect a process’s PID, user, state, runtime, resource use, and full command.- CPU-intensive work is not automatically faulty. Context determines whether it is expected training, serving, preprocessing, or an actual runaway process.
kill PIDsendsSIGTERMby default: a request for orderly shutdown.- Use
SIGKILLonly after verifying the target and confirming that graceful termination failed. - Stop only processes you own and understand; do not use
sudoas a reflexive response to a permission error.
Next, you will build on the commands from this module by writing a shell script that automates a repeatable setup or diagnostic task.
Can't find a good explanation? Sign up and we'll make it for you
Sign up