Hello! Welcome back to our series on managing and scaling your Amazon business.
In our last lesson, we established a data-driven process for managing your FBA inventory, using reports to decide when to restock profitable items and when to remove poor performers. That was about managing the quantity and health of your stock.
Today, we shift our focus to improving the performance of that stock. This lesson directly addresses the learning outcome: to use the 'Detail Page Sales and Traffic' report to identify products for listing optimization. This report is your primary diagnostic tool for understanding why a product might be underperforming. We'll move beyond simply seeing that a product isn't selling and start to diagnose why it isn't selling, so you can take targeted action.
The Diagnostic Tool: Detail Page Sales and Traffic Report
Think of the reports we used in the last lesson as telling you what is happening with your inventory (e.g., "this product is sitting too long"). The 'Detail Page Sales and Traffic' report tells you why it's happening by measuring two critical things:
- Traffic: How many potential customers are visiting your product page?
- Conversion: What percentage of those visitors are actually buying your product?
Answering these two questions allows you to pinpoint whether you have a discoverability problem (not enough traffic) or a persuasion problem (unconvincing product page).
Accessing and Navigating the Report
First, let's get familiar with where to find this report in Seller Central. The path is Reports > Business Reports. From there, you'll look for reports "By ASIN".
How to Track and Improve Your Amazon Conversion Rate
This article, 'How to Track and Improve Your Amazon Conversion Rate,' provides a clear, step-by-step guide with screenshots showing exactly how to navigate to the correct report. Use this as a quick reference for finding your way through the Seller Central menu.
Review the four steps under the heading 'How to Track Conversion Rates on Amazon?'. Pay close attention to Step 4, which directs you to the 'Detail Page Sales and Traffic By Parent Item' or 'By ASIN' report.
Now that you have a mental map, let's watch a short video where an experienced seller walks through these exact steps in a live account.
You'll Fail If You Don't Understand These Numbers (Amazon Seller Central Reports Tutorial)
In this segment from Camron James's 'You'll Fail If You Don't Understand These Numbers,' he demonstrates how to access the Business Reports and highlights the importance of the 'Detail Page Sales and Traffic' report.
Watch the segment from 10:03 to 12:27. Focus on how he navigates from the main 'Reports' tab to 'Business Reports' and then selects the 'Detail Page Sales and Traffic' view.
Decoding the Key Metrics: Traffic vs. Conversion
Once you have the report open, you'll see a table with many columns. Don't be overwhelmed. We only need to focus on two or three key metrics to make our initial diagnosis.
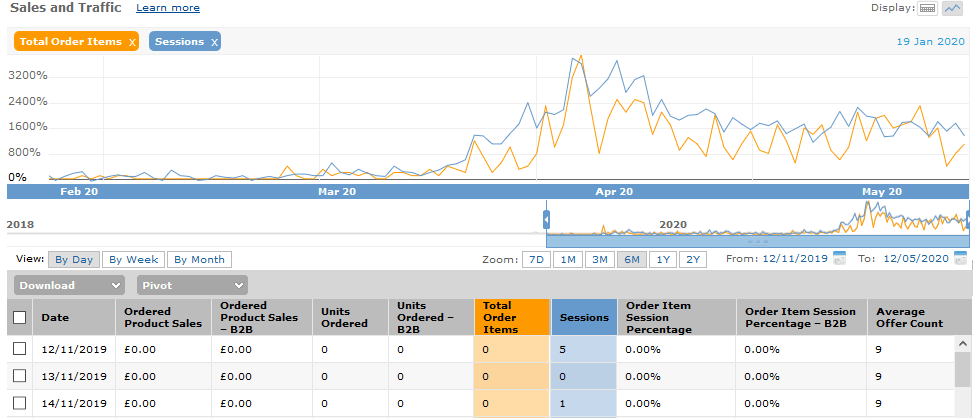
Let's break down the most important metrics, which the next video segment explains very clearly.
You'll Fail If You Don't Understand These Numbers (Amazon Seller Central Reports Tutorial)
This is the most important part of the video from Camron James. He explains the meaning of 'Sessions' and 'Unit Session Percentage' and, crucially, how to interpret them to diagnose the health of your product listing.
Watch the segment from 12:27 to 17:28. Pay close attention to his definitions and the actionable advice he gives: Sessions: What this metric means (unique visitors). Unit Session Percentage: Understand that this is Amazon's term for Conversion Rate. The Diagnostic Rule: Listen for what he says to do if your conversion rate is low (work on your page) versus if your sessions are low (send more traffic). Note the benchmark he gives: a 10-20% conversion rate is considered good on Amazon.
To summarize the core diagnostic framework:
- Sessions: The number of unique customer visits to your product page within a 24-hour period. Low sessions indicate a traffic problem. People aren't finding your product. The solution involves improving your product's SEO or running ads (topics we cover in detail later).
- Unit Session Percentage: The number of units ordered divided by the number of sessions. This is your conversion rate. A low conversion rate indicates a listing problem. People are finding your page but aren't being persuaded to buy. The solution is to optimize your product listing.
Test your understanding!
You are analyzing the 30-day performance of two products in your 'Detail Page Sales and Traffic' report:
| ASIN | Sessions | Unit Session Percentage |
|---|---|---|
| Product A | 5,200 | 4.5% |
| Product B | 150 | 18.0% |
Based on this data, what is the primary problem for each product, and what general type of action should you prioritize for each?
Show answer
-
Product A has a conversion problem. It's getting plenty of traffic (5,200 sessions), but very few visitors are buying (only 4.5% conversion rate, which is well below the 10-20% benchmark). The priority for Product A is listing optimization (improving images, title, price, etc.).
-
Product B has a traffic problem. The visitors who find it are very likely to buy (excellent 18% conversion rate), but very few people are finding it (only 150 sessions). The priority for Product B is increasing traffic (improving SEO or launching an ad campaign).
How to Fix a Conversion Problem: A Practical Optimization Checklist
When your report points to a low Unit Session Percentage, it's time to roll up your sleeves and improve your product detail page. The following video is a masterclass in conversion rate optimization on Amazon. The presenter uses his own highly successful product to demonstrate which elements of a listing have the biggest impact.
How I got a 42% Conversion Rate #1 Funny Wine Glass (FULL GUIDE to Amazon FBA Sales)
The video 'How I got a 42% Conversion Rate' by Steven Pope of My Amazon Guy is a deep dive into the practical tactics for improving your listing. We'll break it down into key optimization areas.
Watch the following segments to build your optimization checklist: Images & Pricing (2:38 - 6:25): Understand why photos are often the most impactful element and how you can test pricing to see if it affects conversion. Title & Reviews (6:25 - 12:45): Learn about the trade-off between short titles for conversion and long titles for SEO. Note the mention of Amazon's A/B testing tool for titles. Customer Demographics (13:40 - 18:12): This is a powerful data-driven strategy. See how to use Brand Analytics to understand your customer's age and gender and use that information to choose more effective secondary images. A+ Content (29:35 - 34:28): Discover how A+ Content can be used to increase conversion (with large, compelling images) and even improve your average order value by cross-promoting other products.
Your Optimization Workflow
Based on everything we've covered, here is a simple, actionable workflow you can implement weekly:
- Navigate: Go to
Reports > Business Reports > Detail Page Sales and Traffic By ASIN. Set the date range to the last 30 or 60 days to get a meaningful amount of data. - Identify: Sort the
Unit Session Percentagecolumn in ascending order (lowest to highest). Your products at the top of the list are the ones that need the most help. - Diagnose: For each low-performing product, look at the
Sessionsmetric. Is the traffic high but conversion low? If yes, proceed to the next step. - Optimize: Work through the optimization checklist for that product listing:
- Images: Are they high-quality? Do they show the product in use? Do they speak to your target demographic (use Brand Analytics)?
- Price: Are you competitive? Is your Buy Box percentage high? (This is another column in the report).
- Title: Is it clear and compelling? Could it be simplified to improve conversion?
- Reviews: What is your star rating? A rating below 4.3 stars can significantly harm conversion.
- Bullet Points & A+ Content: Does your first bullet point clearly state the main benefit? Is your A+ Content visually engaging and reinforcing your value proposition?
By following this data-driven process, you stop guessing and start making targeted improvements that directly address the weaknesses revealed in your reports.
Conclusion
You now have the knowledge to transform the 'Detail Page Sales and Traffic' report from a confusing table of numbers into a powerful diagnostic tool. By systematically identifying and fixing your low-converting listings, you can significantly increase your sales without spending a single extra dollar on advertising.
Key Takeaways:
- The 'Detail Page Sales and Traffic' report helps you diagnose whether a product has a traffic problem (low Sessions) or a conversion problem (low Unit Session Percentage).
- A healthy Amazon conversion rate (
Unit Session Percentage) is typically between 10% and 20%. Anything significantly lower requires your attention. - A low conversion rate is a direct signal to optimize your product listing. The highest impact areas are typically images, price, title, reviews, and A+ Content.
- Use Brand Analytics to understand your customer demographics and tailor your visual content to them for higher conversion.
Next Up:
We've now covered two key aspects of managing your Amazon account: inventory health (IPI and restocking) and sales performance (listing optimization). In our next lesson, we will focus on the third crucial pillar: account compliance. We will learn how to monitor and interpret key Amazon account health metrics (ODR, VTR) to prevent policy violations. This is about protecting your entire business from suspension and ensuring you can continue to sell on the platform long-term.