
Hello. In the previous lesson, you translated a business request into an analytical question and a measurable KPI. Now we turn to the columns that will supply the evidence for that KPI. Before calculating anything, an analyst needs to know what each column means.
A sales spreadsheet may contain product names, order numbers, regions, dates, revenue, quantities, and status labels. They can look equally “data-like,” but they play very different roles in analysis. Correctly classifying them helps you choose sensible Excel formulas, filters, PivotTable rows and columns, and later, SQL and Power BI fields.
By the end of this lesson, you should be able to classify spreadsheet columns as identifiers, dimensions, measures, or dates—including the common cases that cause confusion, such as numeric IDs, postal codes, percentages, and years.
Start with what one row represents
Column classification only makes sense when you understand the grain of the dataset: what one row represents.
For example:
| Dataset | One row represents | Likely identifier | Likely measures |
|---|---|---|---|
| Sales transactions | One order line | Order line ID | Sales, quantity, discount |
| Customer list | One customer | Customer ID | Customer lifetime value |
| Employee roster | One employee | Employee ID | Salary, tenure |
| Monthly product report | One product in one month | Product + month | Revenue, units sold, profit |
A field can be meaningful only in relation to this row-level meaning. If each row is a sale, Sales is a measure recorded for that sale. If each row is a customer, Sales might instead mean the customer’s lifetime sales or sales during a specific reporting period.
Before examining a spreadsheet, state one sentence such as:
“Each row represents one completed customer order.”
That sentence becomes your reference point for interpreting every column.
The four column roles
Think of a dataset as a set of observations. Some columns tell you which observation or entity you are looking at; some describe it; some locate it in time; and some quantify it.
| Column role | Main purpose | Typical examples | Usually summed or averaged? |
|---|---|---|---|
| Identifier | Uniquely refers to a record or business entity | Order ID, Customer ID, Employee number, SKU | No |
| Dimension | Describes, groups, filters, or segments records | Region, product category, channel, customer type, status | No |
| Date | Places a record in time | Order date, ship date, month, year, timestamp | No |
| Measure | Quantifies an amount, count, value, or duration | Revenue, units sold, profit, cost, rating, delivery time | Often, but only when the aggregation makes business sense |
The most useful mental model is:
- Identifiers answer: Which specific thing is this?
- Dimensions answer: What kind, where, who, or which group?
- Dates answer: When?
- Measures answer: How much, how many, how long, or how well?
For example, in an order-level dataset:
| Order ID | Order Date | Region | Product Category | Sales | Units Sold |
|---|---|---|---|---|---|
| 10482 | 2025-02-03 | West | Furniture | 850 | 2 |
Order IDidentifies this order.Order Datetells you when it occurred.RegionandProduct Categorydescribe the order.SalesandUnits Soldquantify the order.
An analyst might calculate total sales by region over time. That simple sentence shows how the four roles work together: measures are calculated, dimensions provide the groups, and dates establish the time period.
Dimensions and measures: the central distinction
The core distinction in reporting tools is usually between dimensions and measures.
A dimension is a descriptive field used to organize data. You might use it to filter, group, sort, or label a report:
- Sales by Region
- Profit by Product Category
- Orders by Customer Segment
- Support tickets by Status
A measure is a quantitative field that you can calculate meaningfully:
- Total Sales
- Average Order Value
- Maximum Delivery Duration
- Total Units Sold
The key word is meaningfully. A number is not automatically a measure.
For example, adding Customer IDs might produce a number, but that number has no business meaning. By contrast, summing sales values gives total sales, which is a meaningful business metric.
The following short video gives a useful decision rule: first check whether a field is numeric; then ask whether summing, averaging, or otherwise aggregating it would make logical business sense.
Tableau Dimensions and Measures EXPLAINED | #Tableau Course #46
Watch “Tableau Dimensions and Measures EXPLAINED” by Data with Baraa. Although it uses Tableau, the classification logic applies directly to Excel, SQL, and Power BI.
Watch the overview for the relationship between dimensions, measures, and business questions. Then watch the decision rule, which explains why numeric fields are not automatically measures. Finish with the examples, especially the treatment of customer IDs, postal codes, order dates, sales, and quantity.
Identifiers: numbers that should not be calculated
An identifier is a field whose purpose is to distinguish a record or entity. It may be unique in a dataset, such as an Order ID, or it may repeat because the same entity appears in several transactions, such as a Customer ID in an orders table.
Common identifiers include:
- Customer ID
- Order ID
- Invoice number
- Employee ID
- Product ID
- Account number
- SKU
- Ticket ID
- Tracking number
Identifiers are often numbers, but their digits function as labels, not quantities.
Suppose a customer table contains these values:
| Customer ID | Customer Name | Lifetime Sales |
|---|---|---|
| 10031 | Amina Khan | 2,400 |
| 10032 | Leo Martin | 850 |
| 10033 | Priya Shah | 1,900 |
It makes sense to calculate average lifetime sales. It does not make sense to calculate average Customer ID.
Numeric does not mean measurable
These fields may look numeric but are generally not measures:
| Field | Classification | Why |
|---|---|---|
Customer ID | Identifier | It labels a customer. |
Order Number | Identifier | It labels an order. |
Postal Code | Dimension | It represents an area, not a quantity. |
Product Code | Identifier | It labels a product. |
Phone Number | Identifier or contact attribute | Its digits are not quantities. |
Year | Date or time dimension | It locates records in time. |
Store Number | Identifier | It labels a store. |
A useful test is: Would a total or average of this column help a business decision? If not, it is not a measure.
Identifiers can be repeated legitimately
Do not assume an identifier must appear only once.
Imagine a table where each row represents an order line, not a whole order:
| Order ID | Line Number | Product | Units Sold |
|---|---|---|---|
| 20451 | 1 | Keyboard | 1 |
| 20451 | 2 | Monitor | 2 |
| 20452 | 1 | Mouse | 3 |
Here, Order ID repeats because one order can contain multiple products. It still identifies the order; it simply does not uniquely identify the individual row. The combination of Order ID and Line Number identifies an order line.
This distinction becomes especially important when you later remove duplicates or join tables in SQL. Repeated IDs are not necessarily an error.
Dimensions: the labels that make measures useful
A dimension is a descriptive attribute that lets you divide a measure into meaningful groups.
If total sales are , the number alone says little. Add a dimension, and you can ask more useful questions:
- Total sales by region
- Total sales by product
- Total sales by sales channel
- Total sales by customer segment
- Total sales by month
Typical dimensions include:
- Product name and category
- Country, city, region, and store
- Department and team
- Customer segment
- Sales channel
- Subscription plan
- Order status
- Payment method
- Employee role
- Yes/no flags, such as
Returned?orOn Time?
Dimensions are often text fields, but they can also be numeric codes or logical values. A postal code is a dimension. A field containing 0 and 1 to represent “No” and “Yes” is usually a dimension or category indicator, even though Excel stores it as a number.
Read the following Metabase Learn explanation for a compact account of why descriptive fields, numeric codes, and dates are treated as dimensions rather than quantities.
Measures and dimensions | Metabase Learn
Read “Measures and dimensions” from Metabase Learn to reinforce the practical difference between descriptive fields and computable values.
In the section “Dimensions: the who, what, where, and when of your data,” read the dimensions explanation. Focus on why IDs can contain digits without being quantities, and why dates are generally used for grouping rather than addition. Then, in “Measures: numerical fields that you can compute,” read the measure examples. Notice that a field becomes a measure because calculations on it are useful, not merely because it has a numerical data type.
Dates: dimensions with special analytical value
A date field tells you when an event occurred or when an entity was created, updated, or scheduled. Dates are generally treated as a type of time dimension, but it is useful to identify them separately because time-based analysis is so common.
Typical date fields include:
- Order Date
- Ship Date
- Invoice Date
- Signup Date
- Last Login Date
- Due Date
- Created At timestamp
- Month
- Quarter
- Year
You normally use dates to:
- Filter to a reporting period, such as the last quarter
- Group sales by month
- Compare current performance with a prior period
- Calculate elapsed time, such as days from order to delivery
- Identify trends and seasonality
You would not calculate the sum of order dates or the average of years as a business result.
A useful distinction:
| Field | Classification | Reason |
|---|---|---|
Order Date | Date | Records when the transaction occurred |
Year | Date or time dimension | A time grouping, not a quantity |
Delivery Duration (days) | Measure | Can be averaged or compared |
Customer Age | Measure, in many contexts | Average and distribution can be meaningful |
Fiscal Quarter | Date or time dimension | A reporting period category |
Excel sometimes stores dates internally as serial numbers. For example, a date could display as 03/02/2025 but be stored as a number behind the scenes. Its intended business meaning is still a date, not a measure.
Classifying a realistic sales table
The Dimensions and Measures sales table illustrates a typical reporting dataset.
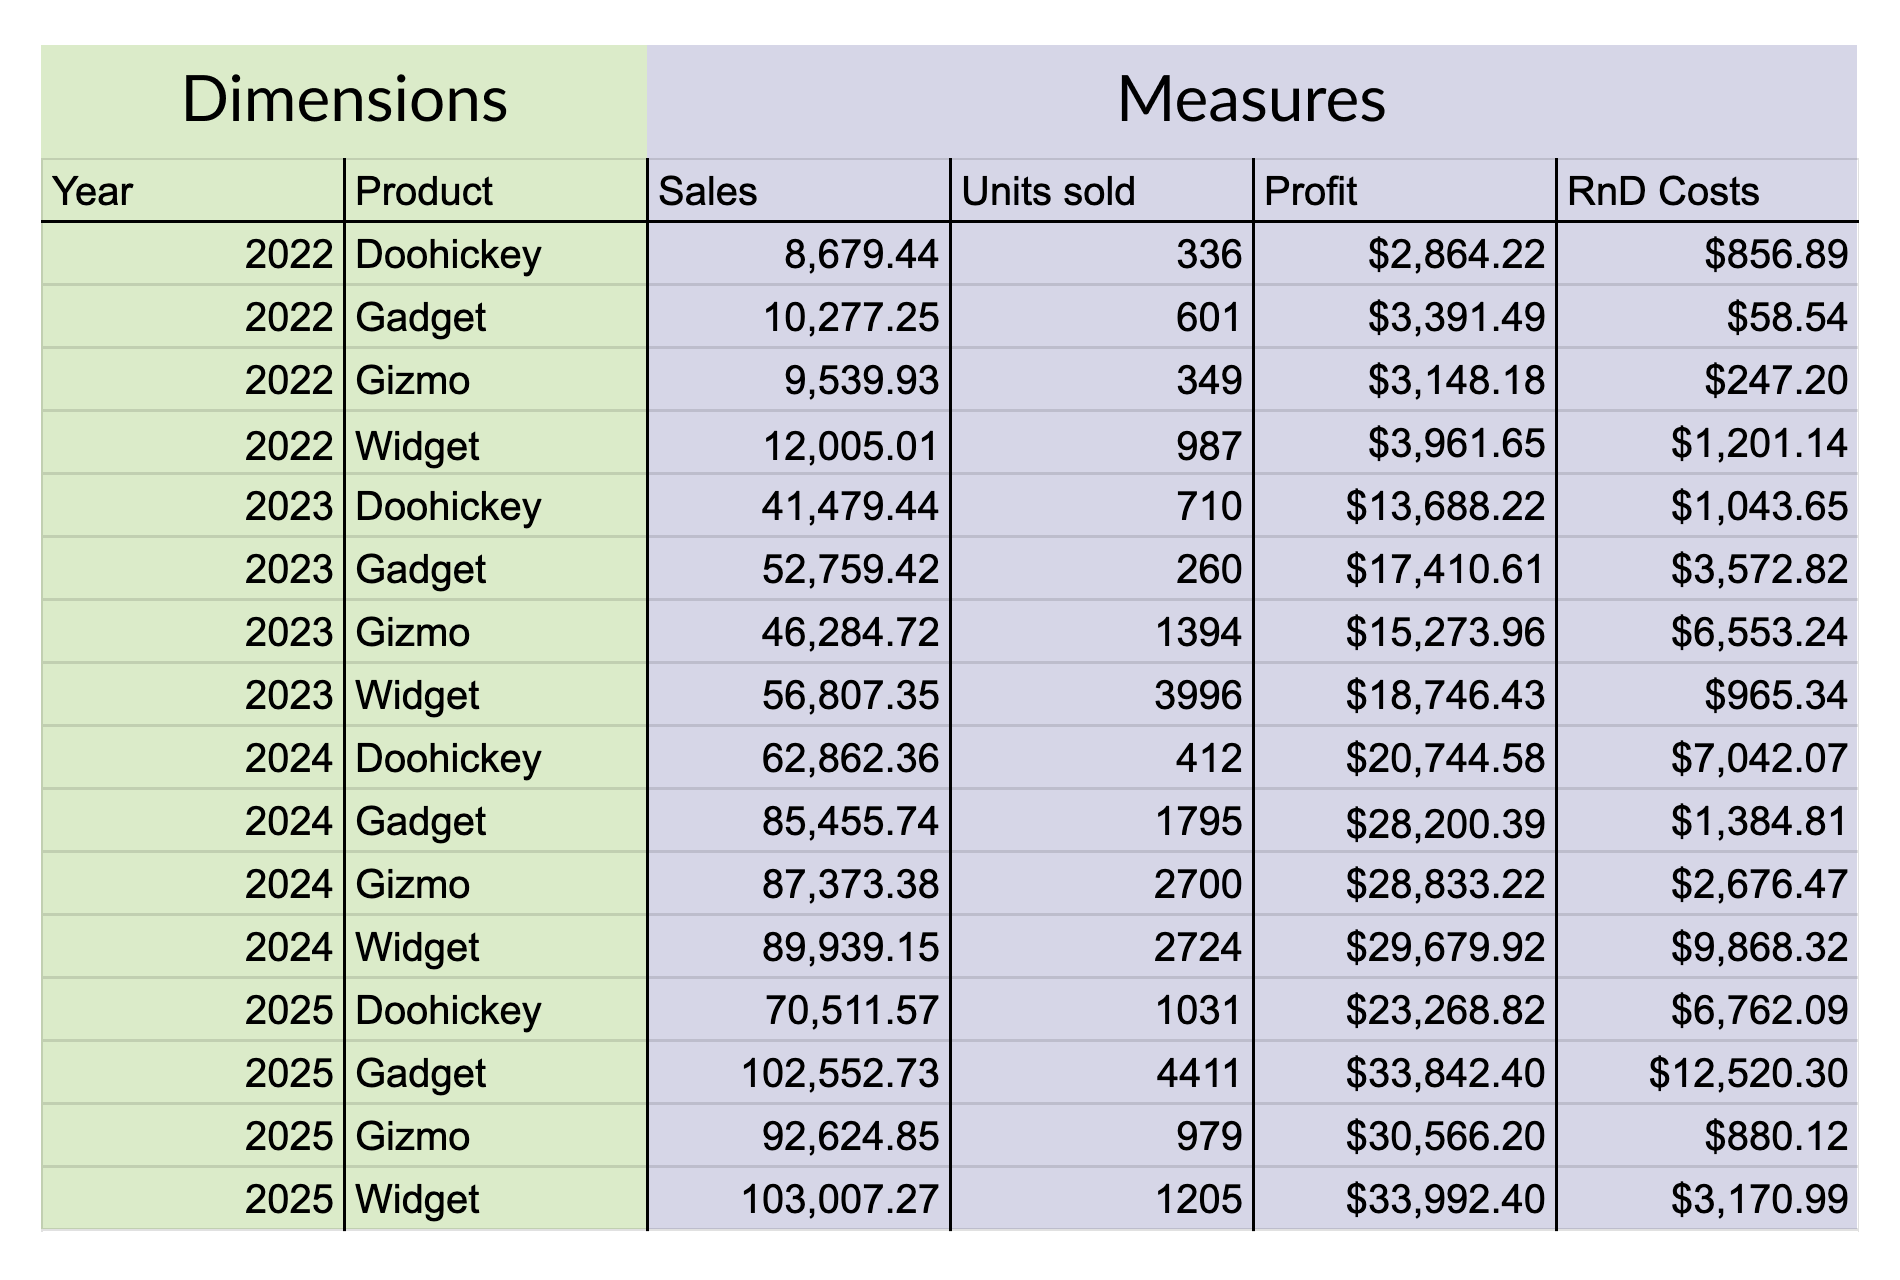
The image labels Year and Product as dimensions, and that is correct in a business intelligence sense. In our more detailed classification:
| Column | Classification | Why |
|---|---|---|
Year | Date or time dimension | It locates the observation in time. |
Product | Dimension | It groups and describes the sales records. |
Sales | Measure | You can calculate total or average sales. |
Units sold | Measure | You can calculate total units sold. |
Profit | Measure | You can calculate total profit or profit margin. |
RnD Costs | Measure | You can calculate total costs or compare costs over time. |
The grain appears to be:
One row represents one product in one year.
Therefore, 2024, Gizmo identifies a product-year observation, and the measure values quantify that observation.
This is the basic pattern behind a large share of business reporting:
Measure a numerical outcome, grouped by dimensions and analyzed over dates.
A second example: a student dataset
The student spreadsheet below contains a mixture of all four roles.
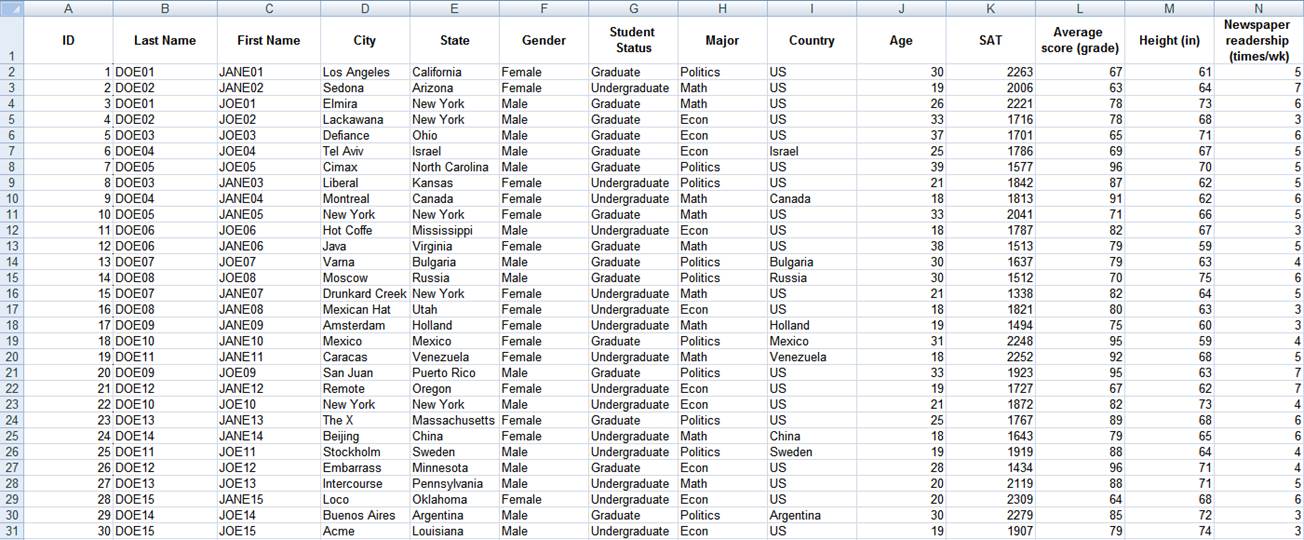
A sensible first-pass classification would be:
| Column group | Classification | Examples from the spreadsheet |
|---|---|---|
ID | Identifier | Identifies the student record |
Last Name, First Name | Dimensions | Descriptive attributes; names may not be unique |
City, State, Gender, Student Status, Major, Country | Dimensions | Useful for grouping or filtering students |
Age, SAT, Average score, Height, Newspaper readership | Measures | Values that can be analyzed numerically |
One caveat: the correct classification depends on the business question. For instance, Age can be averaged, so it usually acts as a measure. But an analyst may also create age bands, such as “18–24” or “25–34,” which would be a dimension. The raw field’s primary meaning is quantitative; the derived age group is categorical.
Measures are not always summed
A measure is a numeric field that can be analyzed, but the correct operation varies by measure.
| Measure | Useful aggregation | Usually avoid |
|---|---|---|
| Sales | Sum | Averaging when total performance is the question |
| Units Sold | Sum | — |
| Unit Price | Average, minimum, maximum | Sum |
| Discount Percentage | Average or weighted calculation | Sum |
| Customer Rating | Average, minimum, maximum | Sum |
| Delivery Duration | Average, median, maximum | Sum |
| Profit Margin | Weighted calculation or careful averaging | Sum |
For instance, Unit Price is clearly a measure because it is numerical and analytically valuable. Yet adding all unit prices rarely answers a useful question. The classification tells you it is a quantity; business context tells you how to summarize it.
Similarly, a Returned Flag coded as 1 for returned and 0 for not returned can sometimes be summed to count returns. But its original meaning is a category or indicator, not an amount of money or units. Before summing it, verify the coding and confirm that every record follows the same rule.
A reliable classification procedure
When you open an unfamiliar spreadsheet, classify columns using this sequence.
-
Identify the row grain.
Determine whether each row is an order, customer, employee, product, support ticket, or another observation. -
Look for fields that identify an entity or record.
Names containing words likeID,Number,Code,SKU, orReferenceoften indicate identifiers. Check the values too; field names can be imperfect. -
Locate dates and timestamps.
Look for dates stored as proper dates, text that resembles dates, years, months, and time fields such asCreated At. -
Ask which remaining fields describe the observation.
Categories, locations, statuses, types, channels, and demographic attributes are usually dimensions. -
Ask which remaining numeric fields can be calculated meaningfully.
Revenue, cost, quantity, score, duration, and balance fields are common measures. -
Check for exceptions.
Numeric codes, phone numbers, postal codes, and IDs are not measures. A date stored as a number is still a date. A percentage is a measure, but may not be summed.
You can document the result in a simple data dictionary:
| Column | Role | Description | Example use |
|---|---|---|---|
Order ID | Identifier | Unique code for an order | Locate an order; check duplicates |
Order Date | Date | Date the customer placed the order | Monthly trend analysis |
Region | Dimension | Customer sales region | Sales by region |
Sales | Measure | Net sales value per order | Total sales |
Units Sold | Measure | Number of units on the order | Total units sold |
This small table is useful in job tasks and portfolio projects because it shows that you understand the dataset before analyzing it.
Common mistakes to avoid
Treating every number as a measure
Account numbers, ZIP codes, staff codes, and invoice numbers may be numeric, but arithmetic on them is meaningless. Their digits carry labels, not magnitude.
Treating dates as ordinary numbers
Excel may store a date as a serial value, but analysts should classify it as a date. It should support time filtering, trends, comparisons, and duration calculations.
Relying only on a column name
A column called Value could be revenue, a customer code, a score, or a date serial number. Inspect example values and, where possible, confirm the business definition.
Assuming an identifier must be unique in every row
An ID may identify a customer or order but repeat in a transaction table. Repetition can be expected at the table’s grain.
Summing every measure by default
Some measures should be summed, while others should be averaged, counted, minimized, maximized, or calculated using a ratio. The business question determines the appropriate aggregation.
Key takeaways and next step
Column classification gives structure to your analysis:
- Identifiers distinguish records or business entities and should not be treated as quantities.
- Dimensions describe and group observations: product, region, status, channel, and similar attributes.
- Dates are time dimensions used for filtering, grouping, trends, and period comparisons.
- Measures quantify the observation and support meaningful calculations, though not every measure should be summed.
- Numeric-looking fields require interpretation. Postal codes, IDs, and years are often not measures.
- Always begin by identifying what one row represents.
Next, you will use these classifications to structure an Excel dataset correctly: one observation per row and one variable per column.
Can't find a good explanation? Sign up and we'll make it for you
Sign up