
Welcome back. In the previous lesson, you saw the full analyst workflow: clarify the decision, define success, prepare reliable data, analyze, communicate findings, and recommend an action. This lesson zooms in on the step that gives all later work direction: converting a vague business request into a question that data can answer and a KPI that can be measured consistently.
For entry-level analyst work, this is also an interview-critical skill. Before writing an Excel formula, SQL query, or Power BI measure, you should be able to state: What decision is being supported? What exactly are we trying to learn? How will success be measured?
A request is not yet an analytical question
Consider these typical stakeholder requests:
- “Sales are down. Find out why.”
- “We need more customers.”
- “Improve delivery performance.”
- “Is the new marketing campaign working?”
- “Customers are unhappy with the app.”
Each expresses a real concern, but none is specific enough to analyze. A request usually omits important choices:
- Which sales measure: revenue, units sold, gross profit, or number of orders?
- Compared with which period, target, or benchmark?
- For which customers, regions, products, or channels?
- What decision will the stakeholder make using the result?
- What does “working” or “improve” mean numerically?
Starting analysis without resolving these ambiguities is how an analyst ends up with a polished dashboard that does not answer the question the business actually cares about.
A practical way to translate the request is to separate four layers:
| Layer | Purpose | Example |
|---|---|---|
| Business request | The stakeholder’s broad concern | “Delivery performance is poor.” |
| Business objective | The desired business outcome | Improve the customer delivery experience while controlling cost. |
| Analytical question | The precise question data should answer | “Which delivery regions and time slots contributed most to late deliveries last month?” |
| KPI | The defined measurement of performance | On-time delivery rate |
The analytical question tells you what to investigate. The KPI tells you how performance will be measured. They are connected, but they are not interchangeable.
For example, “on-time delivery rate” is a KPI, not a question. “Which regions have the lowest on-time delivery rate, and where has it deteriorated most compared with the previous month?” is an analytical question.
Start with the decision and objective
Before selecting metrics, identify the decision behind the request. The decision determines whether a metric is actually useful.
Suppose a retail manager says:
“Our online sales need to improve.”
A weak response would be to immediately choose “website visits” because traffic is easy to obtain. More visitors may be helpful, but traffic does not necessarily improve sales or profit.
Instead, clarify the decision:
Decision: Decide whether next month’s budget should prioritize paid advertising, email re-engagement, or improving conversion on the website.
Objective: Increase profitable online sales next month.
Now the analysis can focus on measures relevant to that decision: revenue, orders, conversion rate, average order value, marketing cost, and perhaps gross profit.
This distinction matters:
- An objective is the outcome the organization wants.
- A metric is any quantitative measurement.
- A KPI is a metric selected because it is important for monitoring progress toward the objective.
- A target is the desired level of a KPI, such as “reach 95% on-time delivery.”
A KPI can be well-defined even before a target exists. For instance, a new company may first need to establish a reliable baseline before setting a sensible target.
The short video below presents a job-oriented process for moving from an overall business goal to supporting metrics and a final KPI. One terminology note: the presenter calls certain supporting views “key visualizations.” In practice, think of these as diagnostic metrics and breakdowns that help explain the primary KPI.
Steps To Define Key Performance Indicators(KPI's) for Data Analyst
Watch “Steps To Define Key Performance Indicators(KPI's) for Data Analyst” by Krish Naik. It provides a concise example of starting from a business objective, identifying the factors and measures relevant to it, and then setting a measurable KPI.
Watch the business goal for the starting point: define the objective before choosing measures. Continue with supporting factors and candidate metrics; focus on how broad revenue performance is broken into smaller, decision-relevant measurements. Finish with finalizing KPIs, where the example adds a specific comparison and target.
Write an analytical question that data can answer
A strong analytical question narrows a broad concern without prematurely assuming the answer. It is neither too vague nor so narrow that it predetermines the conclusion.
Compare these versions:
| Version | Question | Problem or strength |
|---|---|---|
| Too broad | “Why are sales low?” | “Sales” and “low” are undefined; there is no period or comparison. |
| Assumes a cause | “Did higher prices cause sales to fall?” | May be worth investigating, but it assumes price is the explanation before evidence is examined. |
| Specific and analytical | “How did net revenue and order volume change in the last quarter versus the prior quarter, and which product categories contributed most to the change?” | Defines outcomes, comparison period, and breakdown. |
| Decision-focused | “Which product categories should the merchandising manager prioritize next quarter based on revenue decline, margin, and recent demand?” | Connects analysis to a decision. |
Use this template as a starting point:
For [population or scope], how did [outcome] change over [time period] compared with [baseline or target], and which [segments, drivers, or factors] explain the largest share of the difference to support [decision]?
Not every question requires every part of the template, but it prevents common omissions.
Example: a delivery business
Business request: “Customers complain that deliveries are late.”
Clarification: The operations manager must decide where to add delivery capacity and whether to change delivery-slot scheduling.
Analytical question:
Among completed deliveries in the last four weeks, what was the on-time delivery rate by city and delivery time slot, how did it compare with the previous four weeks, and which groups accounted for the most late deliveries?
This question establishes:
- Population: completed deliveries
- Time period: last four weeks
- Comparison: previous four weeks
- Outcome: on-time delivery rate and late-delivery count
- Dimensions for diagnosis: city and delivery time slot
- Decision: where to intervene operationally
It does not state that drivers, traffic, warehouses, or staff caused lateness. Those can become hypotheses after the first analysis shows where the issue is concentrated.
Example: a subscription service
Business request: “We are losing customers.”
Analytical question:
For customers whose subscriptions were eligible for renewal during the last quarter, what was the renewal rate by plan type and acquisition channel, and which segment experienced the largest decline from the prior quarter?
Here, “losing customers” is translated into an observable event: eligible customers renewing or not renewing during a defined period.
Questions that lead to action
A business question should make a later recommendation possible. “What was total revenue last month?” may be useful for routine reporting, but it normally does not diagnose a problem. Adding a comparison and breakdown often makes it actionable:
“How did monthly net revenue compare with target, and which products and regions explain the gap?”
The point is not to make every question long. The point is to make its scope and intended evidence unambiguous.
Define a KPI so two analysts would calculate the same number
A KPI becomes trustworthy only when its definition is operational. Saying “track customer retention” is not enough: different people could calculate it in different ways.
A good KPI definition answers these questions:
| KPI component | What to specify |
|---|---|
| Name | What is the metric called? |
| Business purpose | Which objective or decision does it support? |
| Formula | What is included in the numerator and denominator, or what values are summed? |
| Unit | Currency, count, percentage, days, or another unit |
| Population and exclusions | Which records are included or excluded? |
| Time window | Daily, weekly, monthly, quarterly, or cohort-based |
| Grain | Is each row an order, customer, subscription, support ticket, or delivery? |
| Source fields | Which data fields are needed? |
| Target or baseline | What result is considered acceptable, and what is it compared with? |
| Reporting cadence | How often will it be refreshed and reviewed? |
For the delivery example, a complete definition could be:
KPI name: On-time delivery rate
Purpose: Monitor whether delivery operations meet customer promises.
Formula: Completed deliveries delivered at or before their promised delivery time divided by all completed deliveries.
Unit: Percentage
Scope: Completed customer deliveries; exclude canceled orders and test deliveries.
Time window: Weekly, with comparison to the prior four-week average.
Target: At least 95%.
The formula is:
This definition prevents several avoidable errors. For example, including canceled orders in the denominator would usually lower the reported rate even though no delivery occurred. Including orders without a promised delivery timestamp could make the calculation impossible or inconsistent. Those choices must be visible, not buried in a spreadsheet formula.
The following reading reinforces two useful principles: a KPI is a quantitative indicator of progress toward an objective, and effective KPI selection begins with the objective rather than a list of available columns.
What Are KPIs? Defining Key Performance Indicators [2026] • Asana
Read Asana’s “What Are KPIs? Defining Key Performance Indicators” for a concise business-oriented explanation of what makes a KPI useful and how objectives guide metric selection.
First, in the “What are KPIs?” section, read the definition and selection guidance. Focus on why a KPI should be limited to what matters rather than every available measurement. Then, under “How to set up effective KPIs,” read Steps 1 and 2. Notice the order: define the objective first, then identify metrics directly related to it.
KPI, driver, and guardrail: choose measures with purpose
Most business objectives cannot be understood from one number alone. Still, a dashboard filled with dozens of equally prominent measures makes it harder to see what matters.
A useful structure has three roles:
| Role | Meaning | Delivery example |
|---|---|---|
| Primary KPI | The main outcome used to judge progress | On-time delivery rate |
| Diagnostic or driver metrics | Measures that help explain movement in the primary KPI | Average delivery duration, late deliveries by city, orders per delivery slot |
| Guardrail metrics | Measures monitored to avoid improving one outcome at an unacceptable cost | Delivery cost per order, cancellation rate, customer complaints |
For an online retailer focused on revenue, net revenue might be the primary KPI. Average order value, conversion rate, site traffic, and refund rate could be diagnostic metrics. Gross margin or discount cost might be guardrails, because revenue can rise while profitability falls.
The KPI tree below illustrates this kind of hierarchy. “Total revenue” sits at the top, with operational efficiency, customer satisfaction, and business growth represented as areas that may be related to it. Lower-level measurements, such as vehicle maintenance costs and app response time, are more specific operational measures.
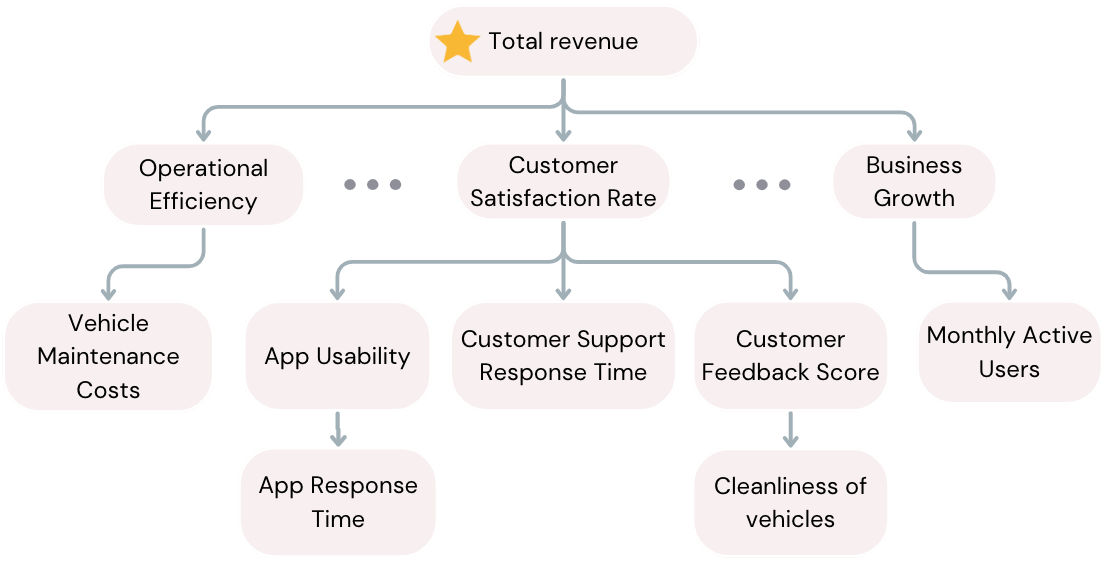
Treat a diagram like this as a measurement map, not proof of causation. For example, app response time may plausibly affect customer satisfaction, and customer satisfaction may be associated with revenue. But the hierarchy alone does not prove that improving app response time will increase revenue. Your analysis must test whether the relationship exists in the available data, consider alternative explanations, and state uncertainty appropriately.
There is one especially valuable distinction:
- Some relationships are direct accounting identities. For example, total net revenue is calculated by summing transaction-level net revenue.
- Other relationships are hypothesized business drivers. Customer satisfaction, product availability, and app usability may influence revenue, but the relationship must be investigated rather than assumed.
This distinction will help you avoid overstating conclusions in both job interviews and workplace reporting.
Make the KPI specific, measurable, and time-bound
The SMART framework is a useful check on whether your objective and KPI definition are sufficiently clear. For analysis, the most important elements are usually specific, measurable, and time-bound.
A vague objective:
“Increase sales.”
A clearer objective and KPI statement:
“Increase monthly net revenue from online orders in California by 4% year over year during February.”
This statement defines:
- Specific: online orders in California
- Measurable: net revenue and percentage growth
- Time-bound: February, compared year over year
The KPI can be expressed as:
Whether the target is attainable or realistic requires business context: capacity, historical performance, budget, seasonality, and leadership expectations. As an analyst, do not invent targets. Ask where the target came from and label it clearly as a target, forecast, baseline, or benchmark.
A quick quality test for a proposed KPI is:
- Can it be calculated from available or obtainable data?
- Would two analysts likely get the same result from the definition?
- Does a change in it matter for the business objective?
- Can the responsible team influence it?
- Does it have a defined population, period, and unit?
- Would it help someone make or evaluate a decision?
If the answer to several of these is “no,” the measure may be interesting, but it is not yet a strong KPI.
A workplace-ready analysis brief
Before beginning a dataset, write a short brief like the one below. This is useful in a portfolio project, a take-home task, or a real analyst role because it makes your assumptions visible.
| Field | Example |
|---|---|
| Stakeholder and decision | Operations manager deciding where to improve delivery capacity |
| Business objective | Meet delivery promises while maintaining delivery cost control |
| Analytical question | Which cities and delivery slots contributed most to late deliveries in the last four weeks compared with the prior four weeks? |
| Primary KPI | Weekly on-time delivery rate |
| Formula | On-time completed deliveries divided by all completed deliveries |
| Scope | Completed customer deliveries; canceled and test orders excluded |
| Diagnostic breakdowns | City, delivery slot, delivery partner, order volume |
| Guardrails | Delivery cost per order, cancellation rate, customer complaint rate |
| Baseline or target | Prior four-week average and 95% service-level target |
| Known limitations | Traffic data is unavailable; delivery-partner assignments may be missing for some orders |
This is not bureaucratic paperwork. It is the bridge between a stakeholder’s language and the calculations you will eventually build in Excel, SQL, Power BI, or Python.
Key takeaways and next step
A broad business request needs to be translated before analysis begins.
- Start with the decision and business objective, not the first available dataset or dashboard visual.
- Turn the request into an analytical question that defines the population, outcome, time period, comparison, relevant breakdowns, and intended decision.
- Define a KPI operationally: include its formula, unit, scope, time window, data assumptions, and target or baseline.
- Use a primary KPI to measure the outcome, diagnostic metrics to understand it, and guardrails to prevent harmful trade-offs.
- A KPI tree represents a useful hypothesis about what to measure; it does not, by itself, establish causation.
Next, you will move from the question and KPI to the dataset itself by learning to classify spreadsheet columns as identifiers, dimensions, measures, and dates.
Can't find a good explanation? Sign up and we'll make it for you
Sign up