
Hello. In the previous lesson, you converted a chart idea into an executable specification: context, trigger, invalidation, target, time exit, and no-trade rules. This lesson adds the constraint that keeps one incorrect hypothesis from becoming disproportionately damaging: risk must be defined before the order is placed.
By the end, you will be able to produce a complete risk plan: choose a stop because the chart thesis is invalidated there, calculate the potential reward relative to that risk, and determine a position size from account value and a fixed per-trade risk budget. The examples use paper-trading conventions and are educational, not personal investment advice.
A stop is an invalidation level, not a pain threshold
A protective stop has two distinct jobs:
- Analytical job: identify the price at which your trade thesis is no longer credible.
- Operational job: place an exit order or rule that limits the loss if that price is reached.
For a long trade, the stop is below entry; for a short trade, above entry. But “below entry” is not a sufficient justification. A stop placed at an arbitrary percentage, or simply where the loss looks tolerable, can be either:
- so close that routine price movement stops you out despite the trade structure remaining valid; or
- so far away that the potential loss is incompatible with your account-risk rule.
The correct sequence is therefore:
- Define the trade setup and planned entry.
- Identify where the setup is invalidated on the chart.
- Place the stop beyond that invalidation, with a predefined buffer if needed.
- Calculate the stop distance.
- Size the position so that the loss at the stop fits your risk budget.
Do not reverse this logic. Choosing a quantity first and then moving the stop until the loss looks acceptable is a common way to create poorly defined trades.
Structural locations for a stop
The exact level depends on the setup you are trading. These are starting patterns, not universal rules:
| Setup | Long-trade invalidation often lies | Why |
|---|---|---|
| Breakout from a range or triangle | Below the last meaningful higher low or below the lower boundary of the structure | A break beneath it means buyers have failed to preserve the setup’s rising structure. |
| Pullback in an uptrend | Below the swing low that defines the pullback | A lower low can signal that the prior uptrend is no longer intact. |
| Bounce from support | Below the support zone, not merely at its upper edge | A genuine break of support contradicts the bounce thesis. |
| Mean reversion within a range | Beyond the far edge of the trading range | Leaving the range means the assumption of continued range behavior has failed. |
For a short trade, reverse the logic: a stop might go above a recent swing high, above range resistance, or above a lower high that defines the downtrend.
A small buffer can prevent the stop from sitting exactly on an obvious level where normal spread or a brief wick may trigger it. Define the buffer in advance, for example as a fixed number of ticks appropriate to the instrument and timeframe. The buffer should not be improvised after entering the trade.
A stop order does not guarantee the exact stop price. During a gap, rapid move, or illiquid period, a stop-market order can fill worse than its trigger price. Treat the calculated risk as planned risk, not an absolute maximum under every market condition. For this reason, exclude obviously unsuitable conditions such as major scheduled announcements if that is part of your plan.
Risk Management & Position Sizing Strategy for Trading
Watch “Risk Management & Position Sizing Strategy for Trading” from Humbled Trader for a chart-first explanation of stop placement, target selection, and reward relative to risk. Treat the numerical examples as illustrations of the method rather than a prescribed trading system.
Watch risk and reward for the relationship between account risk, reward-to-risk, and win rate. Then watch chart levels, focusing on the sequence: identify meaningful support and resistance first, then assess whether the resulting trade has acceptable potential reward relative to risk.
Measure risk and reward in consistent units
Let:
- be planned entry price;
- be stop price;
- be target price.
For a long position, valid prices have .
The price risk per unit is:
The potential price reward per unit is:
The reward-to-risk ratio is:
If the result is , the planned target is times as far from entry as the stop. Traders often call the planned account loss at the stop . In that language, a target with a reward-to-risk ratio of is a potential gain before costs.
For a short position, the arithmetic is mirrored:
A favorable reward-to-risk ratio is not a prediction and not evidence that a trade is good. A distant target can create an impressive ratio while being unlikely to be reached. Conversely, a setup with a modest ratio may still be viable if historical testing shows a suitably high win rate. The next module outcome on journal evaluation will let you connect these figures to expectancy; for now, the objective is to make every planned trade comparable.
Target first or ratio first?
Set the target from a chart-based reason: a prior high, a higher-timeframe resistance zone, a measured pattern objective, or another prewritten exit rule. Then calculate the ratio.
Do not place a target at an arbitrary multiple just to obtain “2R” or “3R” if the chart offers no room before an important resistance zone. If the structural stop is too wide or the realistic target is too close, that is useful information: the appropriate decision may simply be no trade.
Fix account risk before calculating quantity
Your position size should change with the stop distance. A wider stop requires fewer units; a tighter technically valid stop permits more units. This keeps the planned account loss approximately constant across trades.
Choose a fixed risk fraction for a paper-trading test. A conservative starter convention is or of the paper account per trade; the important thing during testing is that you apply one rule consistently. The risk fraction is a choice within a broader plan, not a guarantee against losses.
If account value is and your per-trade risk fraction is , then the maximum planned account risk is:
For a standard share quoted in the same currency as your account, one share has a point value of : a one-pound price move changes the position by one pound per share. Ignoring costs temporarily, the risk-based quantity is:
where is the value of one price point per unit, and the floor symbol means round down to a tradable quantity.
For ordinary shares, is usually in the quote currency. For other products, it can differ:
- A cryptocurrency trade may permit fractional coins, but the quote-currency loss per coin still depends on the price distance.
- A CFD, futures contract, or forex lot can have a contract-specific point value and minimum lot size.
- An account held in GBP trading a US stock quoted in USD must compare the estimated USD loss with the GBP risk budget after currency conversion.
Before using a leveraged product, verify its contract specifications and point value. Leverage changes margin requirements, but it does not make the stop loss less costly per unit. Risk is still driven by quantity and adverse price movement.
5 Elements of a Smart Trade Plan
Read the position-sizing and exit-planning portions of Charles Schwab’s “5 Elements of a Smart Trade Plan.” It gives a clear share-based example showing why the maximum loss per trade and the stop distance must be considered together.
In Section “4. How much to trade: Position sizing and risk management,” read the position sizing discussion. Then continue into Section “5. When to exit: Set exit signals.” Read the worked example beginning “Let’s look at an example of buying…” and follow the share sizing calculation. Notice that the stop distance determines the possible loss per share before the number of shares is chosen.
Worked example: a complete long risk plan
Continue the prior lesson’s logic: a setup is armed only after context and trigger conditions are satisfied. Suppose a hypothetical UK-listed share is quoted in GBP, and a breakout rule has just produced a valid entry signal.
| Plan field | Value | Reason |
|---|---|---|
| Paper account value | Account basis for risk calculation | |
| Maximum risk per trade | Fixed test rule | |
| Risk budget | ||
| Planned entry | Closed-bar breakout trigger | |
| Structural stop | Below the relevant swing low and support zone, including a buffer | |
| Target | Next visible resistance area | |
| Estimated round-trip costs | Commission and execution allowance | |
| Position cap | of account | A separate concentration constraint |
First calculate risk per share:
Then calculate potential reward per share:
The gross reward-to-risk ratio is:
This is a target before costs.
Now reserve for estimated total costs. The quantity calculation is:
The plan is therefore to buy 34 shares, assuming whole shares are required.
At entry, the position’s value is:
This is of the account, so it remains within the example position cap.
If the stop fills exactly at the planned price, the share-price loss is:
Including the estimated costs, planned loss is:
That fits within the budget. At the target, gross price profit would be:
After the same cost estimate, the expected net target profit would be . Notice the distinction:
- Gross chart reward-to-risk:
- Estimated net reward-to-risk: slightly lower because costs reduce returns and increase effective loss
This is why costs should not be an afterthought, particularly for smaller positions, short-term trades, or instruments with wider spreads.
Position size has several limits
Risk-based quantity is necessary, but it is not the only constraint. Before placing a paper trade, choose the smallest valid quantity after checking all relevant limits:
- Risk limit: quantity must not exceed the amount permitted by stop distance and the account-risk budget.
- Capital or margin limit: you must be able to fund the position or meet margin requirements.
- Position concentration limit: one trade should not consume more portfolio exposure than your plan allows.
- Instrument constraints: shares may require whole numbers; products may use minimum lots or contract sizes.
- Execution-cost limit: spreads, commissions, and plausible slippage should not consume an excessive part of planned risk or reward.
- Correlation limit: a new bullish trade in a highly related asset can add risk even if each individual position obeys its own sizing rule.
In the simplified example, the quantity was limited by risk. But imagine the calculated quantity required of capital and your position cap allowed only . You would reduce quantity to the cap, making the actual planned risk lower than the maximum. You would never increase leverage merely to force the full risk amount into a trade.
A useful pre-entry check is:
If filled at my expected entry and stopped at my planned stop, including estimated costs and a realistic allowance for slippage, is the planned loss within my account-risk budget?
If the answer is no, reduce quantity or decline the trade. Do not widen the risk budget after a setup appears.
Map the plan in TradingView
TradingView’s Long Position and Short Position drawings are planning tools, not trade recommendations. They let you see entry, stop, target, quantity, potential profit and loss, and reward-to-risk on the chart before placing an order.
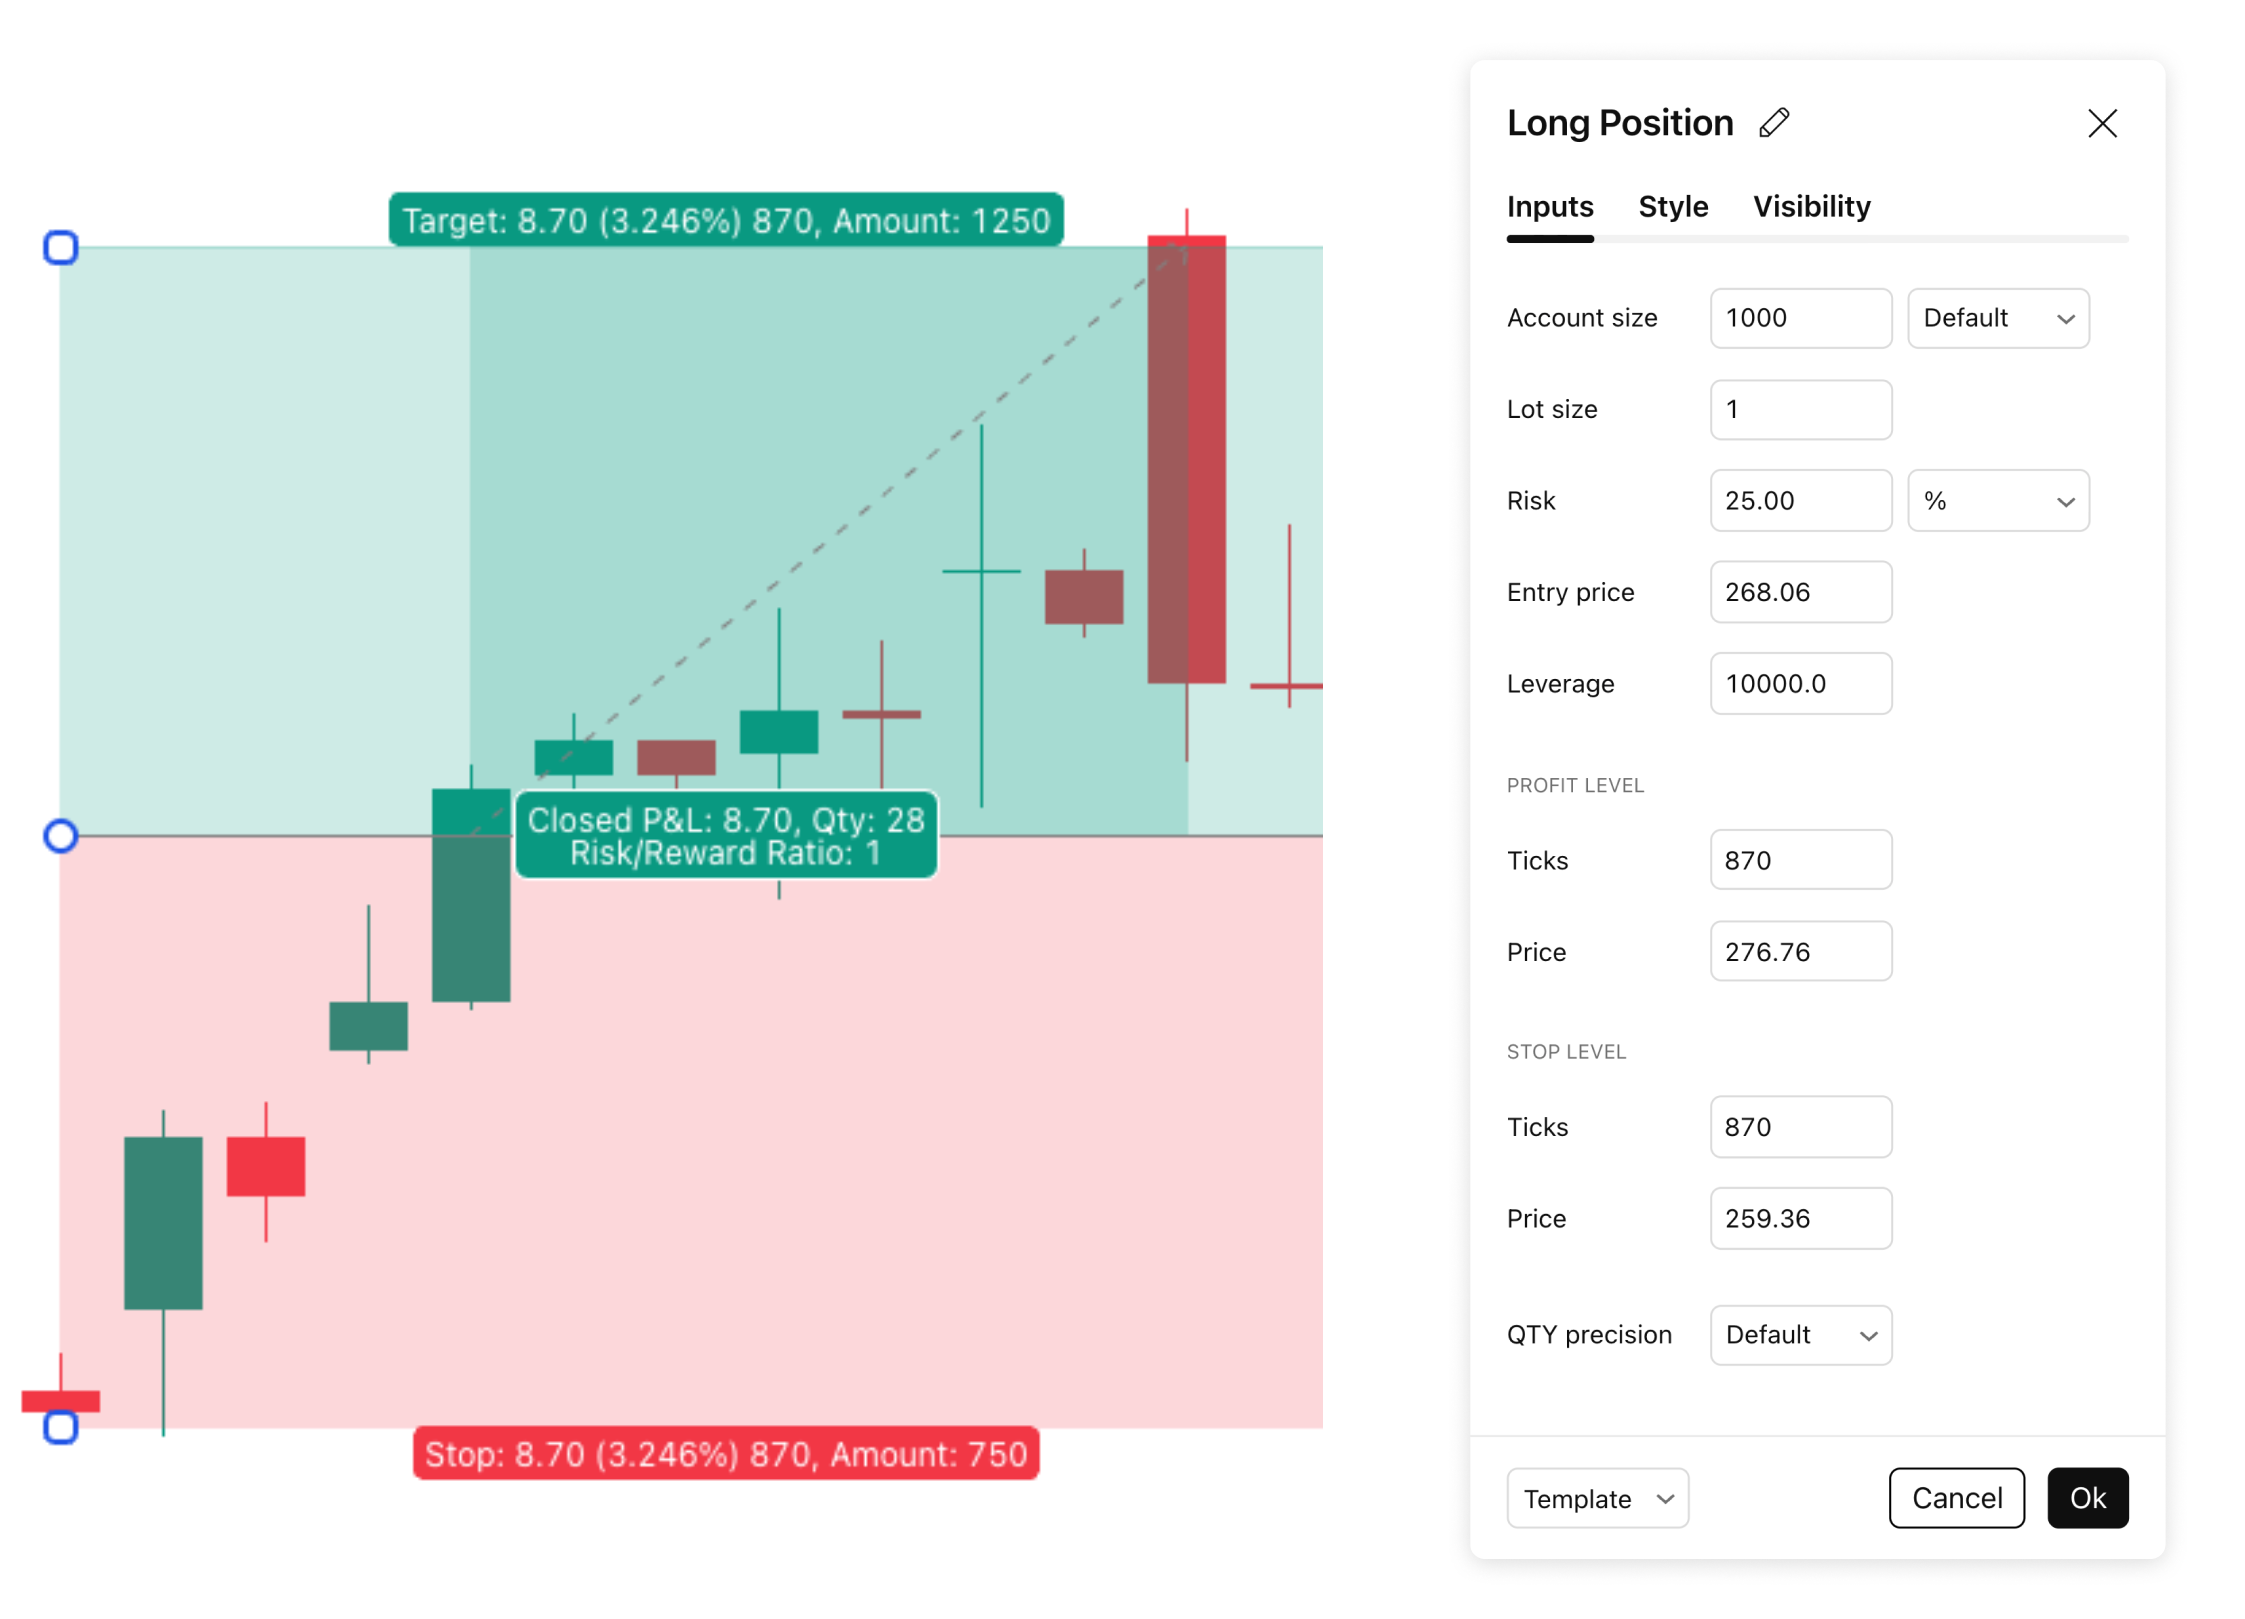
Use this workflow for a long paper trade:
- Mark the planned entry at the level defined by your trigger rule.
- Drag the lower boundary to the technically justified stop level.
- Drag the upper boundary to your chart-based target.
- Double-click the drawing and enter the paper-account size and your fixed risk amount, either as currency or a percentage.
- Set the instrument’s lot-size and quantity precision appropriately.
- Check the displayed quantity, planned loss, potential gain, and reward-to-risk ratio.
- Independently verify that the position respects your exposure cap and that costs or expected slippage have not made the plan unacceptable.
- Only then create a paper order with matching entry, stop, and target parameters.
How Traders Use the Long/Short Position Tool: Tutorial
Watch TradingView’s “How Traders Use the Long/Short Position Tool: Tutorial” for the practical configuration of account size, risk, entry, target, stop, ticks, and quantity within the drawing tool.
Watch tool inputs. In the “Inputs” settings, focus on how changes in account size, risk amount, entry price, target, and stop affect the displayed quantity and projected profit or loss. Use price levels initially; ticks are simply another representation of the same distance.
How to use long and short position drawing tools — TradingView
Read TradingView Support’s guide to connect the visual tool to the underlying quantity and risk calculations. This is useful when the tool’s displayed quantity differs from what you expected.
In “Calculate your position size and account balance,” read the tool overview, then follow steps 1 through 4. Continue to the “How are the position size, account balance, target and stop levels, risk/reward ratio, and PnL calculated?” section and inspect the “Long position” formula table. Focus on how entry-to-stop distance, account risk, point value, lot size, and leverage affect quantity.
A practical warning about tool outputs
The drawing tool calculates from the values entered. It cannot determine whether:
- your stop is structurally justified;
- your target is realistic relative to resistance;
- the instrument’s spread will make the plan poor;
- a correlated position already exists;
- a major event makes the trade inappropriate;
- the actual order type will fill at the drawn entry and stop prices.
In other words, TradingView performs arithmetic and visualization; you provide the trading logic.
Your one-page risk-plan format
For each paper trade, add these fields to the trade specification created in the previous lesson:
| Field | What to write before entry |
|---|---|
| Account value | Current paper-account value and account currency |
| Maximum account risk | Fixed amount and percentage for this trade |
| Entry | Exact trigger and expected fill price |
| Stop / invalidation | Exact stop price and the structural reason for it |
| Stop distance | Price distance and percentage distance from entry |
| Target | Price level and chart-based reason |
| Gross reward-to-risk | Target distance divided by stop distance |
| Costs and slippage allowance | Your pre-defined estimate |
| Position size | Quantity after rounding to legal units or lots |
| Position value | Quantity multiplied by planned entry |
| Exposure and correlation check | Whether portfolio and concentration limits are respected |
| No-trade condition | For example, entry has run too far from the planned price or estimated loss now exceeds the budget |
A complete risk plan for the example could be condensed into one sentence:
“With a paper account, I will risk no more than including estimated costs; after the defined breakout trigger at , I will buy 34 shares, place the stop at because a break below that swing-low support invalidates the setup, and target at the next resistance zone.”
That is specific enough to execute, replay, and later evaluate.
Key takeaways
A risk plan begins with the chart, not with a desired position size. Place the stop where the setup is technically invalidated, adding only a pre-defined buffer where appropriate. Then choose a realistic, chart-based target and calculate reward relative to risk.
Position size follows from the maximum acceptable account risk:
Round down to a valid trade size, account for costs, and apply separate capital, exposure, and correlation limits. A stop reduces planned risk but cannot guarantee an exact fill during gaps or rapid moves.
Next, you will execute a short sequence of these rule-based plans in TradingView Bar Replay, journal the decisions without using future information, and compare planned execution with what actually occurred.
Can't find a good explanation? Sign up and we'll make it for you
Sign up