
Hello. This module marks a useful shift: chart analysis becomes a decision process. A trend, support zone, RSI reading, or triangle pattern may make an idea plausible, but none of them alone tells you exactly when to risk capital—or when to stay out.
By the end of this lesson, you will be able to turn a market hypothesis into a compact, testable trade specification: context, entry trigger, invalidation, exits, and no-trade conditions. The aim is not to predict every move. It is to make a decision rule that could be executed consistently in TradingView paper trading and later reviewed without relying on memory or intuition.
This is educational material, not a recommendation to trade any instrument or a claim that any setup will be profitable.
From an idea to an executable rule
A market hypothesis is a conditional explanation of what you think may happen and why. For example:
“EUR/USD has been rising, then consolidates beneath resistance in an ascending triangle. If buyers can sustain a break above that resistance, continuation upward is more likely than an immediate reversal.”
This is a reasonable analytical statement. It identifies:
- a market structure: rising price followed by consolidation;
- a location: just below resistance;
- a possible mechanism: buyers absorb selling pressure and push through resistance;
- a directional bias: bullish continuation.
But it is not yet a trade. It does not specify:
- precisely what proves the breakout;
- when an order is placed;
- where the idea is wrong;
- how profits are realized;
- what conditions make the setup unacceptable.
That distinction is central:
| Component | Role | Example |
|---|---|---|
| Context / qualifier | Explains why a setup is worth watching | Daily trend is up; price is near a marked resistance zone; volume has contracted in a consolidation |
| Trigger | A precise observable event that authorizes action | A 15-minute candle closes above resistance |
| Execution rule | States the order and timing | Buy at the open of the next 15-minute bar, using paper trading |
| Invalidation rule | Defines what would make the thesis wrong | Exit if price closes below the triangle’s latest confirmed swing low |
| Exit rule | Specifies a planned way to realize gains or end the trade | Exit at a predefined target, a trailing condition, or a time limit |
| No-trade rule | Prevents trades that do not meet the specification | Do not enter if the breakout has already moved too far before the signal is confirmed |
Context tells you where to pay attention. A trigger tells you when to act.
What makes a trigger testable?
A trade trigger is not “the chart looks strong” or “RSI seems bullish.” Those may be useful observations, but two people looking at the same chart could act at entirely different moments.
A testable trigger must be observable in real time and identifiable in historical data. It needs enough precision that, when replaying a chart bar by bar, you can answer yes or no without reinterpretation.
Technical Analysis Series - Entry Triggers (UPDATED)
Watch “Technical Analysis Series - Entry Triggers (UPDATED)” by CryptoCred for a concise explanation of how a trading plan turns an idea into a position, and what makes a trigger useful rather than emotional.
Watch plan and trigger to distinguish the general trade idea from the rules for entry, invalidation, and exit. Then watch good triggers and note the standards: recognisable in real time, repeatable, easy to journal, and tied to the original thesis.
A well-formed trigger answers six questions:
-
Which instrument?
For example, a specific share listing, BTC/USD spot pair, or EUR/USD feed. Avoid vague labels such as “oil” when different instruments can have different prices and liquidity. -
Which timeframe?
A daily close and a 15-minute close are different events. A rule based on one cannot silently become a rule based on the other. -
What exact condition?
“Close above the highest high of the prior ten bars” is testable. “Break out convincingly” is not, unless “convincingly” receives a measurable definition. -
When is the condition evaluated?
For a closed-bar system: only when the selected candle closes. This avoids changing your decision while a candle is still forming. -
What order is placed?
A buy-stop, buy-limit, market order after close, or no order at all are materially different choices. -
What cancels the setup?
A pending idea must expire if its original logic is no longer relevant.
The following statements illustrate the difference:
| Vague statement | Testable rewrite |
|---|---|
| “Buy a strong breakout.” | “Buy only if a 1-hour candle closes above the marked range high.” |
| “Enter near support.” | “Place a buy limit at the midpoint of the pre-marked support zone.” |
| “Use a tight stop.” | “Exit if price trades below the low of the signal candle.” |
| “Take profit when it feels extended.” | “Exit at the next daily resistance zone or after a close below the 20-period EMA, whichever occurs first.” |
| “Avoid choppy markets.” | “Do not trade if the 20-period EMA has changed direction twice in the preceding ten bars.” |
The precise thresholds in these examples are not universal recommendations. The important point is that each version can be applied consistently, recorded, and later evaluated.
Context is evidence, not permission to enter
The most common beginner mistake is to confuse a collection of bullish evidence with an actual entry signal.
Suppose you see all of the following:
- the weekly and daily trends are up;
- price is above a rising moving average;
- RSI is above its midpoint;
- price is consolidating just beneath resistance;
- volume declines during the consolidation.
This may form a strong context for a long idea. Yet it still does not require an immediate purchase. Price can remain below resistance, reverse lower, or break out briefly and fail.
For swing trading, a practical top-down routine is to use a higher timeframe to define the environment and a lower, but still related, timeframe to execute. For example:
- Weekly and daily charts: broad trend, major support/resistance, and market phase.
- Daily or 4-hour chart: the setup and trigger.
Avoid using a weekly thesis with a one-minute trigger at this stage. That gap usually introduces noise and discretionary decisions rather than genuine precision.
Better Trading Opportunities With Market Context
Watch “Better Trading Opportunities With Market Context” by NetPicks Smart Trading Made Simple for a short framing of context and sensible multi-timeframe awareness.
Watch context basics for the distinction between what price is doing and how it is doing it. Then watch timeframe context; for swing-trade analysis, focus on the suggested weekly and daily perspectives and the warning against excessive chart checking.
A useful mental model is:
- Context narrows the field. It determines which setups you are willing to watch.
- The trigger starts the trade. It is the event that changes your status from waiting to in a position.
- Invalidation ends the thesis. It determines when evidence has become sufficiently contrary that you exit rather than reinterpret.
- No-trade rules preserve discipline. They explicitly protect you from forcing a trade because a chart seems interesting.
A starter structure: breakout with a closed-bar trigger
For early paper trading, use a simple trigger rather than combining five indicators and several discretionary conditions. A close beyond a well-defined level is a sensible starting point because it is visible, journalable, and less vulnerable to intrabar noise than reacting to every tick.
The annotated EUR/USD chart below shows this logic visually. The ascending triangle and preceding rise create the context. The move outside horizontal resistance is labelled as the trade trigger. The stop and profit target turn the visual setup into a bounded plan.
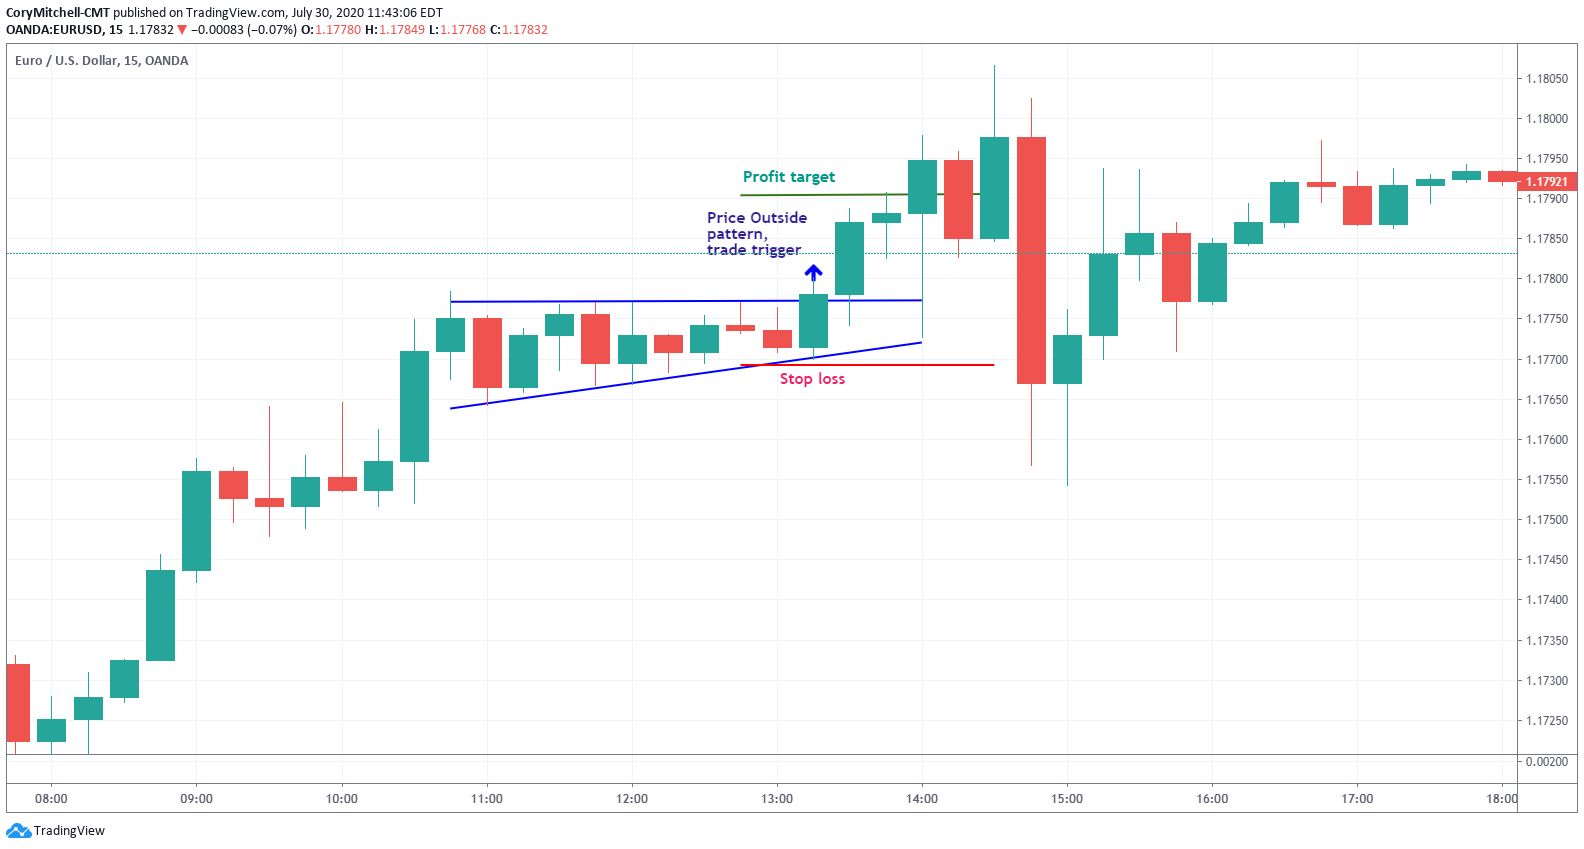
The image is helpful, but notice its limitation: the labels alone do not define all operational details. A testable plan must state whether the trigger is an intrabar break, a candle close, a stop order, or a next-bar market order.
Here is a deliberately simple paper-trading specification based on that chart pattern.
Hypothesis
In an established uptrend, an ascending triangle below resistance may represent a pause in demand. If a 15-minute bar closes above the triangle’s resistance, upward continuation may be more likely than a reversal.
The word may matters. A hypothesis is probabilistic. The plan controls the result when the hypothesis is wrong.
Contextual evidence
All of the following must be true before the setup becomes armed:
- On the 1-hour chart, price has formed higher swing highs and higher swing lows.
- On the 15-minute chart, price has consolidated for at least eight completed bars beneath a horizontal resistance level.
- The consolidation has at least two rising reaction lows.
- The planned target has open space before the next visible resistance zone.
- The setup has not formed immediately before an event you have explicitly chosen to exclude, such as a scheduled major central-bank decision.
These are qualifiers. They say, “this is a place where I am willing to look for a long trade.” They do not say, “buy now.”
Executable entry trigger
Enter long only when a completed 15-minute candle closes above the marked triangle resistance by at least one minimum price increment. Place a paper-market order at the opening of the next 15-minute bar.
This trigger is deliberately based on a completed candle. It avoids the ambiguous situation in which price briefly trades above resistance during the candle, then closes back inside the triangle.
A more aggressive alternative would be a buy-stop slightly above resistance. That could enter earlier, but it also exposes you to more false breakouts and slippage. Do not mix the two approaches while testing. Pick one and record it consistently.
Invalidation and protective exit
At entry, place a protective stop below the most recent confirmed 15-minute swing low inside the triangle, with a small predefined buffer.
The invalidation is not “I am uncomfortable” or “the candle is red.” It is the structural claim:
“The upside-breakout thesis is no longer valid if price breaks below the latest rising low that supported the triangle.”
The stop order is the practical mechanism used to act on that invalidation. In volatile markets, a stop may fill at a worse price than its activation level; it limits risk but does not guarantee an exact execution price.
Do not move the invalidation farther away merely because the trade moves against you. If you want a wider stop, that must be part of the rule before entry and reflected in later position sizing.
Profit-taking exit
A basic target rule might be:
Measure the triangle’s height from its lowest point to resistance. Set an initial target one pattern-height above the breakout level, unless a clearly marked higher-timeframe resistance zone occurs sooner.
The chart uses this general idea: an entry above the pattern, a stop below the structure, and a profit target above. The target is not a prediction that price will reach that level. It is the price at which your plan says to take a defined action if it does.
You also need a rule for the case where neither target nor stop is hit. For example:
If, after twelve completed 15-minute bars, price has neither progressed materially nor reached either exit, close the paper trade at the next bar open.
This is called a time exit. It prevents a short-term breakout plan from silently turning into an unplanned multi-day position.
No-trade rules are real rules
A written trading plan should include explicit conditions under which you do nothing. “No trade” is a valid output of an analytical process, not a missed opportunity.
For the triangle example, a starter no-trade list could be:
- No closed-bar breakout: Price wicks above resistance but the 15-minute candle closes back inside the triangle.
- Late breakout: The signal candle closes so far above resistance that the distance to the invalidation makes the planned trade unattractive under your preset criteria.
- Invalidation occurred first: Price breaks below the rising support structure before the trigger.
- Pattern quality is unclear: Resistance is not reasonably horizontal, the supposed rising lows are not identifiable, or the pattern is based on too few completed bars.
- Major scheduled-event window: Your plan may exclude opening new short-term trades shortly before selected high-impact economic releases or company earnings.
- Unacceptable execution conditions: Spread is unusually wide, the instrument is illiquid, or the simulated fill materially differs from the plan.
- Already in a correlated position: For example, if you already hold a large bullish exposure to a closely related asset, your plan may prohibit adding another similar trade.
The first four rules concern chart logic. The final three recognize that the chart is not the whole trading environment. A technically attractive chart can still be a poor trade if execution conditions are abnormal or if it creates excessive concentrated exposure.
Use a rule hierarchy so exits cannot conflict
Several events may occur during the same trade: a target can be reached, a stop can be touched, a time limit can expire, or a new opposing signal can form. If your rules do not state priority, you may rewrite the decision afterwards.
For a simple starter plan, establish an order of precedence:
- Protective stop / invalidation: exit immediately when the protective level is triggered.
- Profit target: exit according to the predetermined target rule.
- Time exit: if still open at the specified deadline, exit under the defined method.
- Optional discretionary override: omit this entirely while learning. If you allow it, label it separately in the journal as a rule violation or discretionary intervention.
This is intentionally restrictive. Early testing is not about proving that you can improvise; it is about learning whether a clearly specified method produces behaviour you can evaluate.
The trade setup can be represented as a small state machine:
Flat:
  Check higher-timeframe context and setup qualifiers.

Armed:
  Context is valid; wait for the exact trigger.
  If invalidation occurs first or a no-trade condition appears, cancel setup.

Open:
  Record actual entry price, planned stop, target, and time limit.
  Follow exit hierarchy without changing the plan mid-trade.

Closed:
  Record exit reason: stop, target, time exit, or predefined cancellation.
This structure should feel familiar if you think in terms of explicit application states: the important point is that a signal is only accepted in the appropriate state. A breakout trigger is irrelevant if the setup was never armed, or if the setup was already invalidated.
Read a practical pattern example
Read this concise overview for a practical example of transforming a chart pattern into direction, entry, target, and loss limit. It reinforces why each price level needs a reason rather than being drawn after the fact.
Start in “What is swing trading?” and read the setup components. Focus on the four questions: direction, entry, profit target, and loss limit. Then continue to “Example: Swing trading a breakout from a bullish flag.” Read the full example, following how the prior advance, lower-volume consolidation, breakout entry, stop, and two targets form one coherent plan.
The bullish-flag example differs from an ascending triangle, but the logic is identical:
- the earlier move and consolidation form the context;
- the breakout is the entry event;
- the level beneath support is the invalidation;
- measured moves provide candidate exits.
A pattern is not magical. Its value for this course is that it gives a clearly visible structural reference for defining the rule set.
Testability checklist for a trading journal
Before paper-trading any idea, write the following fields in a note or spreadsheet. If a field cannot be completed before the trade, the trade is not ready.
| Field | What to record |
|---|---|
| Instrument and data source | Exact ticker or pair and TradingView feed |
| Trading timeframe | The timeframe that creates the trigger |
| Higher-timeframe context | Trend/range classification and key zone |
| Setup definition | The pattern or condition that arms the setup |
| Entry trigger | Exact condition, evaluated at a specified time |
| Order type | Limit, stop, stop-limit, or market-on-next-bar |
| Planned entry | Exact price or calculation method |
| Invalidation | The market condition that disproves the idea |
| Protective stop | Exact price or calculation method |
| Profit exit | Target price, trailing rule, or both |
| Time exit | When the trade expires if it does not progress |
| No-trade conditions | Conditions that cancel the setup |
| Actual result | Fill, exit, costs, and reason for closure |
| Rule adherence | “Followed,” “missed,” or “violated,” with a brief factual note |
For a paper-trade journal, treat the actual fill separately from the planned entry. This is important because a rule might be conceptually sound while its execution assumptions are unrealistic due to spread, gaps, or slippage.
A final quality check is to rewrite the plan in a single conditional sentence:
“If [context qualifiers] are true, then I will [order action] only when [trigger] occurs; I will exit if [invalidation] occurs, take profit using [exit rule], and do nothing when [no-trade conditions] apply.”
If that sentence contains words such as strong, near, clean, obvious, big, or probably, either define them or remove them. They are often signs that a rule is still subjective.
Key takeaways
A market hypothesis is an explanation of a possible opportunity, not an instruction to trade. Context and qualifiers identify where an opportunity may exist; an executable trigger is the exact event that authorizes entry.
A complete starter plan specifies:
- the instrument and timeframe;
- contextual evidence and setup conditions;
- one observable entry trigger;
- an invalidation level and protective exit;
- a profit-taking and, where appropriate, time-based exit;
- explicit no-trade conditions;
- a journal format that distinguishes planned from actual execution.
The purpose of these rules is not certainty. It is consistency: you should be able to replay the same chart, make the same decision, and later determine whether the method—not a changing interpretation—produced the outcome.
Next, you will turn these exits into a proper risk plan: placing technically justified stops, calculating reward relative to risk, and determining position size from a maximum acceptable account risk.
Can't find a good explanation? Sign up and we'll make it for you
Sign up