
Good to see you again. In the previous lesson, you made a trade plan executable: define the entry, place a structurally justified stop, choose a chart-based target, and size the position from a fixed account-risk limit.
Now you will put that plan under the discipline of simulated time. TradingView Bar Replay hides the future and reveals price one bar at a time, allowing you to practise the decision process rather than merely admire historical winners. By the end of this lesson, you will be able to run a short, rule-based replay session, execute simulated orders, and create a journal record that can later be evaluated honestly.
This is educational paper practice, not investment advice. The immediate goal is not to prove that a strategy is profitable from a few trades. It is to produce trustworthy observations.
Replay is a simulation of decisions, not a search for good-looking charts
A completed historical chart contains a dangerous amount of information. You can see which breakout succeeded, where the exact swing low was, and which RSI divergence mattered. If you choose entries after seeing that outcome, you are not testing a trading process; you are selecting examples with hindsight.
Bar Replay changes the information available to you. You choose a historical starting point, and TradingView redraws subsequent price bars progressively. At each point, you should act as though that visible chart is the latest market data in the world.
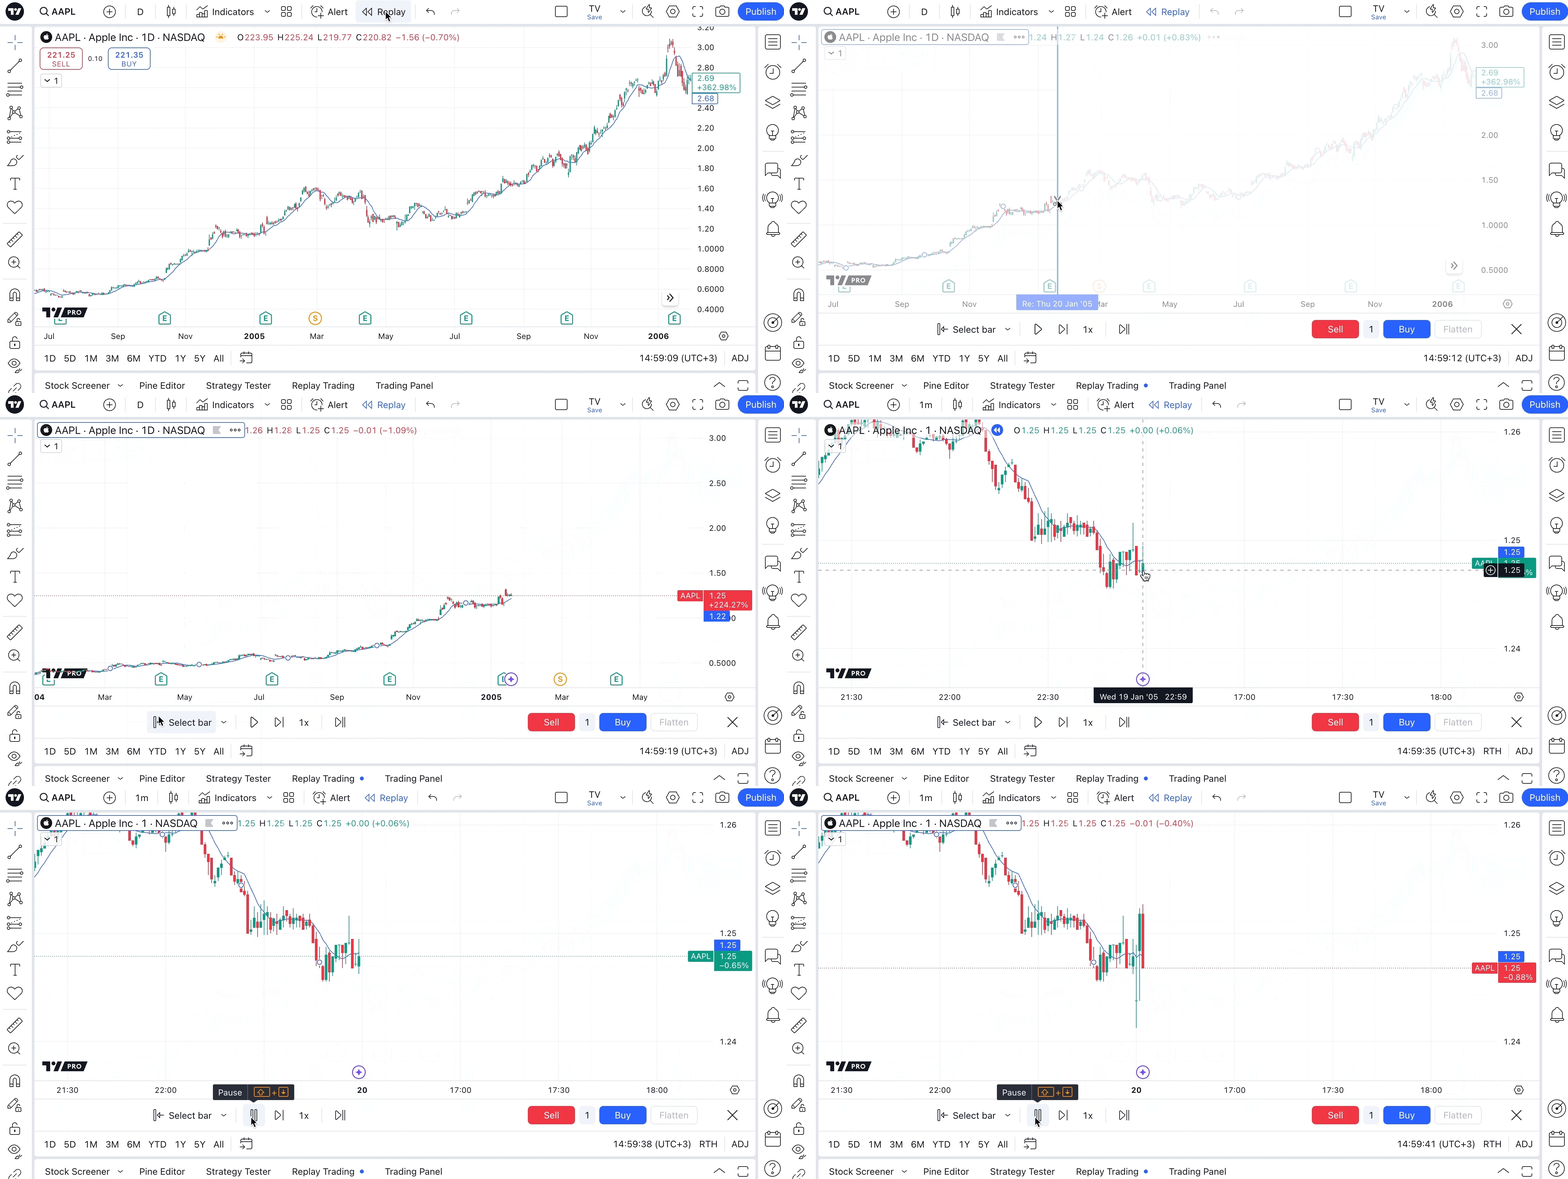
The standard to use throughout the session is simple:
Every entry, exit, order adjustment, and no-trade decision must be justifiable using only the bars visible at that moment.
This prevents look-ahead bias: an error in which future information affects a historical decision. Look-ahead bias can arise in less obvious ways than directly looking right on the chart:
- Drawing support or resistance based on a future high or low.
- Declaring a swing low “important” only because price later rallied from it.
- Moving a stop to breakeven after seeing that the next bars would reverse.
- Entering a trade retrospectively because a move “would clearly have worked.”
- Ignoring losing setups while recording winning setups.
- Changing an indicator setting after observing its later performance.
For this first replay sequence, work on a daily chart and make decisions only after a daily bar has closed. This removes much of the ambiguity of intrabar price movement and lets you focus on the rules already studied: market structure, volume, trend, entry trigger, invalidation, target, and position risk.
The replay decision cycle
Think of each new completed bar as a discrete system update. You observe the current state, apply the same rule set, record the decision, and only then allow the next bar to appear.
Use this cycle repeatedly:
- Pause at a completed bar. Read price structure, volume, and your selected indicators from the chart as it currently appears.
- Check the rule set. Does the chart meet every required condition? If not, do nothing.
- Write the decision before revealing another bar. This may be “no trade,” “place a limit order,” or “enter at market.”
- If entering, define protection immediately. Record the fill, stop, target, quantity, and planned risk. Place the corresponding bracket protection in Replay Trading.
- Advance the chart. Use one-bar advancement for a decision point or a slower playback speed while the trade is open.
- Manage only according to prewritten rules. If your plan has no trailing stop, partial exit, or breakeven rule, do not invent one during the replay.
- Journal the exit immediately. Record whether the stop, target, time exit, or a prewritten discretionary exit rule closed the trade.
The sequence matters. A target or protective stop placed after the next bar appears is not an order you could have placed at the time.
Set up Replay Trading and protect the data quality
TradingView distinguishes Paper Trading from trading within Bar Replay. Replay Trading is designed for a historical simulation session. Its trade data and overall results are available in that session, rather than being a permanent journal, so maintain your own record outside the platform.
Learn to trade on historical data — TradingView
Read TradingView’s support guide to see how Replay Trading is launched, configured, and managed. Pay particular attention to the initial-capital and commission settings: they are part of the test assumptions, not decorative preferences.
In the opening portion of “Learn to trade on historical data,” read the setup instructions. Before beginning a replay, configure an account value, base currency, and commission assumption that you will keep unchanged for this short sequence. In the next portion, beginning “Trading on historical data is available immediately after selecting the starting point,” read order and position management. Notice that Replay Trading supports market, limit, stop, and stop-limit orders, as well as chart-based take-profit and stop-loss controls. Finish with the portion beginning “When buying a position on the chart,” reading the reporting section. The platform report is useful for checking fills, but it does not replace an external decision journal.
For a first test, reduce unnecessary variables:
| Choice | Recommended first-session convention | Reason |
|---|---|---|
| Instrument | One liquid symbol only | A sequence should test one rule set, not differences among markets. |
| Timeframe | Daily | Clear closed-bar decisions; less noise and fewer execution details. |
| Account currency | Match the instrument quote currency where possible | Avoid adding currency conversion to this exercise. |
| Risk per trade | The fixed fraction from your prior lesson, such as | Makes outcomes comparable in , rather than just money. |
| Position management | Stop, target, and one time-exit rule only | Prevents improvisation. |
| Number of trades | Three to five completed trades | Enough to practise the workflow, far too few to validate a strategy. |
For example, use a USD paper account for a daily AAPL replay, or a GBP paper account for a UK-listed share quoted in GBP. Save cryptocurrency and cross-currency cases for later sessions, when you can isolate their different spread, trading-hour, and volatility characteristics.
Before starting, remove old manual drawings that might reveal future levels. A moving average or RSI can remain if it is part of your defined chart template: it is calculated from bars already available at the current replay point. But an old trendline drawn with knowledge of later price action is contaminated data.
TradingView’s tutorial offers a useful visual orientation before you begin.
Practice Trading With Bar Replay: Tutorial
Watch “Practice Trading With Bar Replay: Tutorial” from TradingView for a concise platform walkthrough. The useful lesson is not the presenter’s illustrated trade idea; it is the discipline of placing an order and protective levels before the subsequent price action is revealed.
Watch Replay orientation to see how a chosen candle becomes the current simulated moment and how playback controls work. Then watch simulated execution for the Buy, Sell, and Flatten controls. Treat these as execution tools, not signals. Finally, watch protective levels. Focus on the sequence: define a stop at a thesis-invalidating level and a target at a relevant resistance area before watching the trade develop.
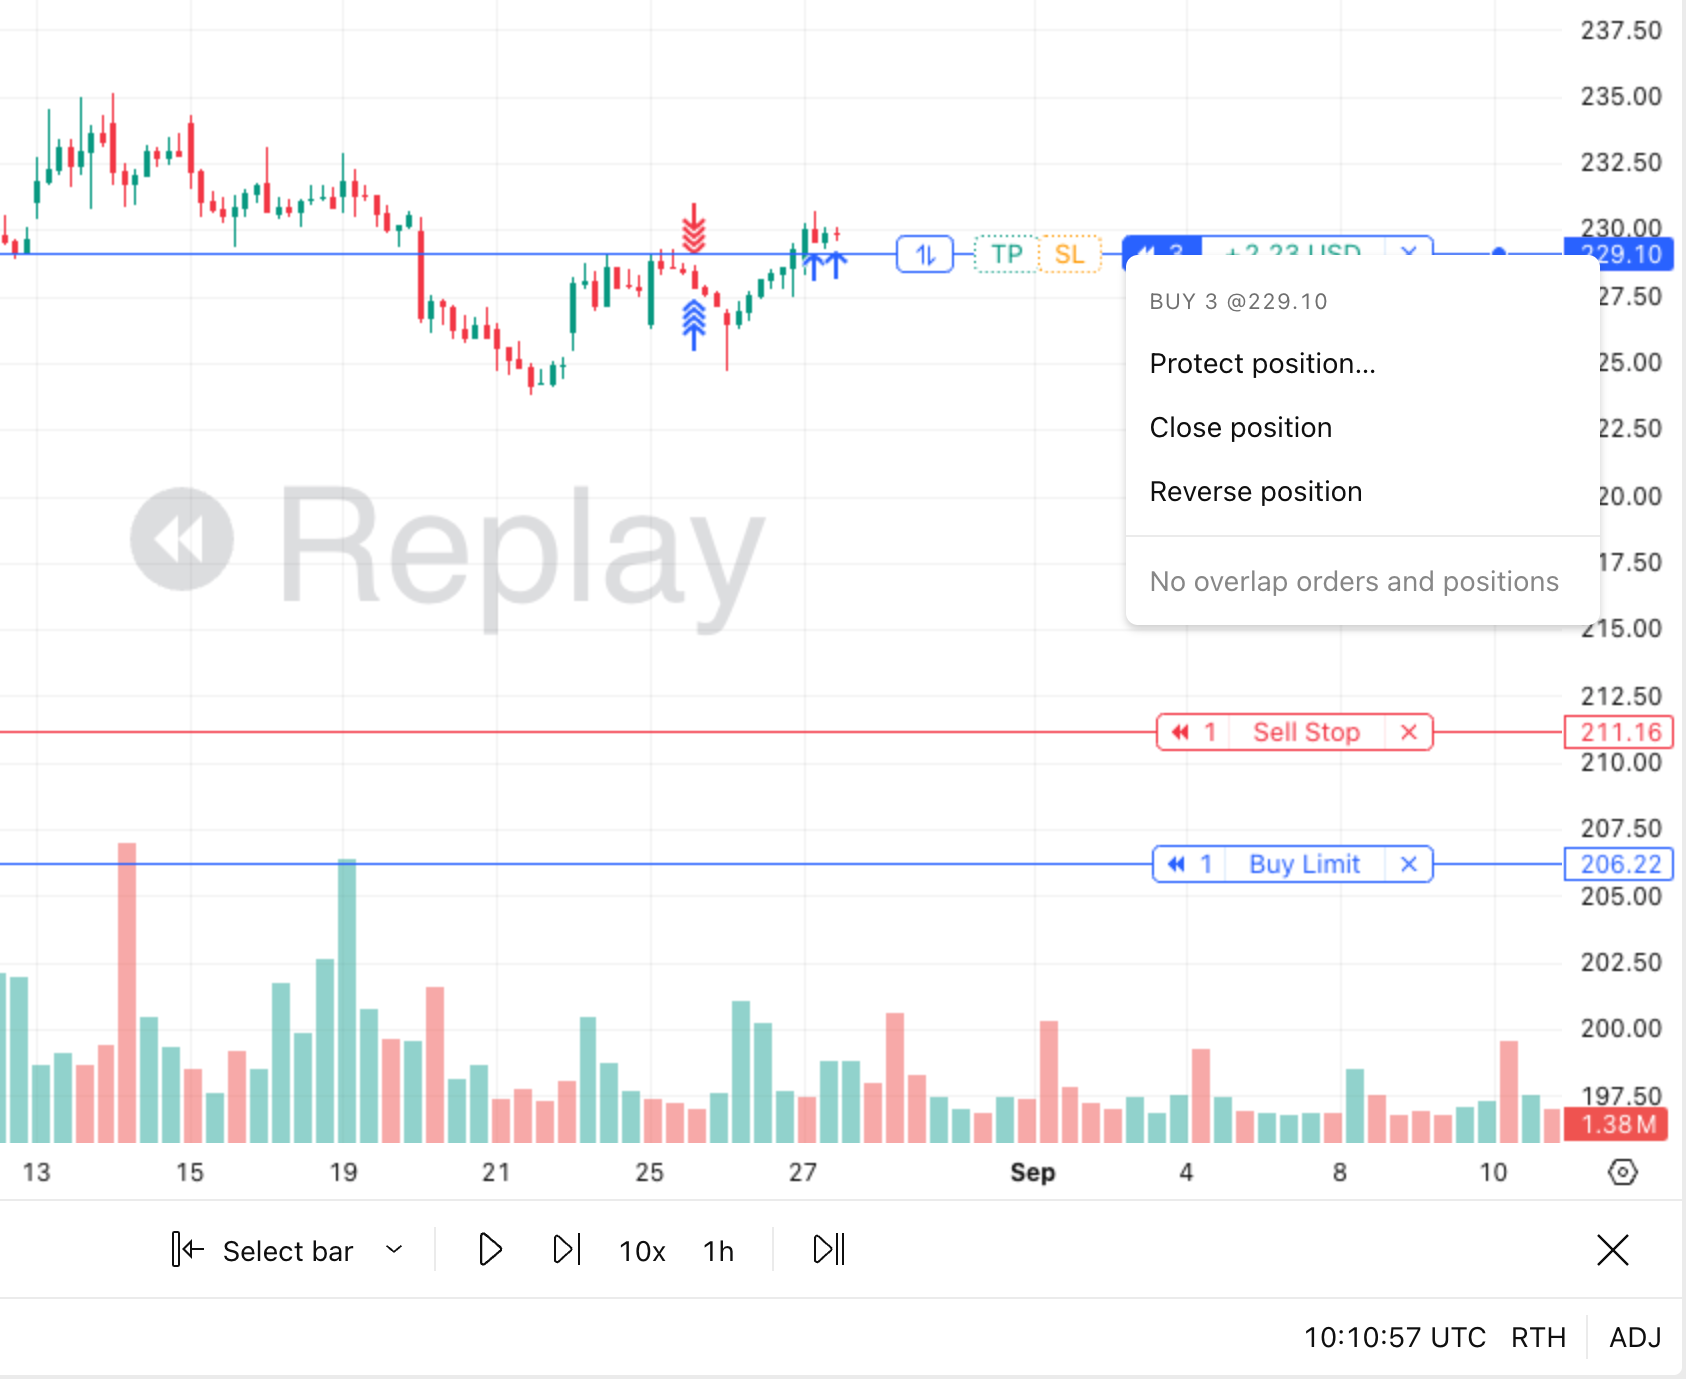
Interface labels and layout details can change, but the process does not: configure first, decide using visible data, place orders before the next bar, and record what happened.
A deliberately simple practice rule
You already have the building blocks for a trade plan. To make this replay exercise concrete, use the following practice protocol for one session. It is not presented as a proven profitable strategy. It is a controlled rule set that makes your decisions auditable.
Practice Rule v1: daily breakout continuation, long only
Use a daily chart with Volume, a 20-period EMA, and a 20-period volume average.
A long trade is eligible only when all of the following are true at the close of the current daily bar:
- You have no open position and no pending order.
- The current close is above the highest high of the previous 20 completed bars. Do not include the current bar in that 20-bar comparison.
- The 20-period EMA is rising, defined here as its current value being above its value five bars earlier.
- Current volume is greater than its 20-period average.
- The stop distance is acceptable under your existing risk rule and any position-size or exposure cap.
When all conditions are satisfied:
- Enter using the preselected execution convention and record the actual Replay Trading fill.
- Put the stop below the lowest low of the signal bar and the preceding five completed bars, with the same predefined buffer convention used in the prior lesson.
- Set the target at , where is the planned loss from entry to stop, including the cost allowance used in your plan.
- Size the position from the account-risk limit. Round down to a legal quantity.
- Do not add to the position, take partial profits, reverse, or move the stop.
- If neither target nor stop is reached after 15 completed daily bars, close the position using a market exit and mark it as a time exit.
This rule has intentional limitations. It tests only bullish breakouts, it excludes short trades, and a target may not always align with a higher-timeframe resistance zone. In a later strategy-design phase, you would refine such issues. For now, changing those rules mid-session would destroy the comparability of the sample.
Selecting the historical starting point
Choose a period you have not recently studied in detail. TradingView’s Random bar option can reduce the temptation to choose a known dramatic rally or crash. Record the exact symbol, exchange, timeframe, and replay start date in the journal.
Do not begin immediately after an IPO or at a point with too little previous data for the EMA, volume average, and 20-bar breakout rule. You need enough visible history to calculate and inspect the conditions legitimately.
If no valid trade appears after a substantial number of bars, that is data. Log a zero-trade session and do not loosen the conditions just to create action.
Execute the sequence without hindsight
The following is your practical session protocol. It should take approximately 15–20 minutes for the first three completed trades, depending on how often the rule triggers.
Before pressing Play
Write the fixed assumptions at the top of the journal:
- Strategy name and version: “Practice Rule v1.”
- Symbol, exchange, timeframe, and starting date.
- Initial account value and currency.
- Commission setting and any fixed slippage assumption.
- Maximum account risk per trade.
- Entry, stop, target, and time-exit rules.
- The statement: “I will not alter rules after observing outcomes.”
Then activate Bar Replay, select the start bar, and ensure that future bars are hidden. Set a manageable speed. For every possible signal, pause and use one-bar advancement.
At a possible entry
When price appears close to a 20-bar breakout, do not predict that it will qualify. Advance until the bar has closed. Then check every condition in the same order.
A useful entry record looks like this:
“At the close of 2022-06-24, the daily close exceeded the prior 20-bar high; the 20 EMA was higher than five bars earlier; volume exceeded its 20-day average. I entered long at the simulated fill of USD 138.00, with the stop at USD 132.00 and target at USD 150.00.”
The exact prices above are only a format example. Your journal must use the price actually shown in your replay session.
Place the protective stop and target immediately. If you use a limit entry rather than a market entry in a later test, place the pending order before continuing. If price never reaches it, the trade did not occur. It is not valid to award yourself a later, more favorable entry.
While a position is open
Your job is not to improve the outcome through hindsight. Your job is to follow the rule.
- Advance at a speed slow enough that you can see whether an order has been triggered.
- Do not close early because the unrealized loss feels uncomfortable.
- Do not move the stop to breakeven merely because the trade was briefly profitable.
- Do not expand the target because later momentum now looks strong.
- If the 15-bar time exit occurs, close at the available simulated price and record it, even if the next bar would have reached the target.
This fixed-management approach makes the result interpretable. If you later wish to test a breakeven rule or a trailing stop, make it a separate version of the strategy and collect a fresh sample.
At exit
Record the actual exit price shown by Replay Trading, the exit reason, and any difference between the planned and realized outcome. A stop exit is not evidence of failure if the plan was followed; it is a planned realization of risk. A target exit is not proof that the method works. Both are observations.
Express each result in monetary terms and in :
For example, if planned risk including estimated costs was USD 50 and net profit was USD 95, the trade produced . If net loss was USD 52 because the fill and costs were slightly worse than planned, it produced .
The result makes trades with different prices and position sizes comparable. Do not calculate a win rate or draw conclusions about profitability from three trades yet; the next lesson will address the statistics and their limitations.
Build a journal that can be reviewed later
A useful journal is both a data table and an audit trail of your reasoning. You can build it in a spreadsheet, a note database, or a plain structured document. Given your development background, a spreadsheet with fixed columns and data validation is a practical starting point: it reduces inconsistent labels such as “SL,” “stop,” and “stopped.”
Use three groups of fields.
| When | Journal fields | Purpose |
|---|---|---|
| Before entry | Session ID, strategy version, symbol, timeframe, date, market structure, rule checklist, entry order type, intended entry, stop, target, position size, planned risk, initial reward-to-risk | Proves that the plan existed before the outcome. |
| During trade | Bar count in trade, any permitted management action, exact rule supporting that action | Makes unplanned interventions visible. |
| After exit | Fill prices, exit reason, gross and net P/L, realized , costs, rule adherence, screenshot, one factual observation | Creates data for later analysis without rewriting history. |
Add two especially important columns:
- Visible-through timestamp: the latest bar date and time visible when you made the decision.
- Rule adherence: use one of
Followed,Minor operational issue, orRule violation.
A losing trade that followed the rules is more useful than a profitable trade created by a rule violation. Treat these as different categories when you review results.
Record no-trade decisions too
You do not need to write a row for every ordinary bar. But record every clear candidate that was rejected and every fully valid setup that you did not take.
Examples:
| Situation | Journal note |
|---|---|
| Price made a new 20-bar high, but volume was below average | “No trade: volume filter failed.” |
| Breakout and volume qualified, but stop-based quantity exceeded exposure limit | “No trade: exposure constraint.” |
| A valid setup occurred while another position was open | “No trade: one-position rule.” |
| You noticed a valid signal only after advancing several bars | “Missed signal: not included as an executed trade.” |
This prevents a subtle but common distortion: treating every historical winner as though it was taken while quietly excluding signals that were missed, rejected, or lost.
Screenshot discipline
Take one screenshot at entry and one at exit. On the entry screenshot, annotate only information available then:
- breakout level;
- EMA direction;
- volume condition;
- entry, stop, and target;
- the one-sentence thesis.
Do not annotate it later with phrases such as “perfect breakout” or “obvious reversal.” Those descriptions use outcome knowledge. If you add a post-trade comment, date it explicitly as a post-exit observation.
Key takeaways
Bar Replay is valuable because it limits the chart to information that would have been available at the simulated moment. Use it to practise a fixed decision cycle: evaluate only closed bars, check the rules, place orders and protection before the next bar, then journal the outcome without rewriting the story.
For this first sequence, keep the test intentionally narrow: one instrument, one timeframe, one rule version, fixed risk, fixed stop/target logic, and three to five completed trades. A small sample cannot establish an edge, but it can reveal whether the rules are specific enough to execute and whether you actually follow them.
In the next lesson, you will turn this journal into evidence by calculating win rate, average win, average loss, expectancy, and maximum drawdown—while accounting for costs, limited sample size, and rule violations.
Can't find a good explanation? Sign up and we'll make it for you
Sign up