
Hello! Welcome to your next lesson in the "Designing and Interpreting Experiments" module.
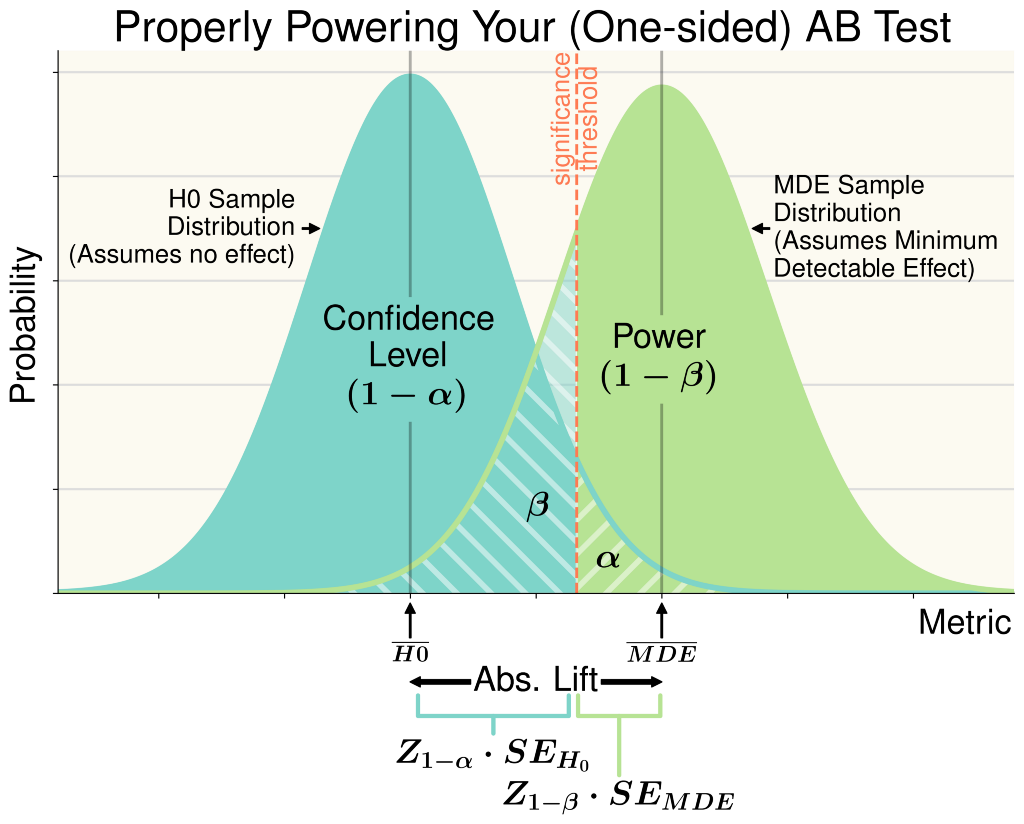
In our last session, we focused on the crucial planning phase of an A/B test. We established that to run a valid experiment, you must first determine the required sample size based on four key ingredients: significance level, statistical power, baseline conversion rate, and—most importantly from a strategic perspective—the Minimum Detectable Effect (MDE). You now understand the trade-offs involved and how to calculate the necessary test duration.
Today, we move from planning to action. Your test has run, the data is in, and the moment of truth has arrived. This lesson will equip you to interpret A/B test results, including confidence intervals and p-values, to make a confident ship/no-ship decision.
As a leader, your role isn't just to read the numbers but to understand their implications, weigh the evidence against business goals, and make a sound judgment call. We'll focus on translating statistical outputs into clear business decisions and communicating them effectively to your team and stakeholders.
1. The Statistical Toolkit for Decision-Making
After an experiment concludes, your analytics platform or team will provide you with several key metrics. The two most important are the p-value and the confidence interval. Let's demystify what they are and how to use them.
The P-Value: A Measure of Surprise
In our first module, we introduced hypothesis testing. As a quick refresher, every A/B test has two competing hypotheses:
- Null Hypothesis (H₀): There is no real difference between the control and the variation. The observed lift is just random chance.
- Alternative Hypothesis (H₁): There is a real difference between the control and the variation.
The p-value answers a very specific question: "If the null hypothesis were true, what is the probability of seeing a result at least as extreme as the one we observed?"
A low p-value means your result is very surprising if you assume there's no real effect. This "surprise" is evidence against the null hypothesis.
To get a clear, foundational understanding of this concept, let's watch a short video.
P-values and significance tests | AP Statistics | Khan Academy
This Khan Academy video, 'P-values and significance tests,' provides a clear, step-by-step explanation of what p-values are and how they're used in hypothesis testing.
Please watch from the beginning until 07:58. Focus on these key points: The Setup (00:23 - 01:55): How a test is framed with a null/alternative hypothesis and a significance level (alpha). What a P-Value Is (02:06 - 04:26): Pay close attention to the definition—it's the probability of the data, given the null hypothesis is true. The Decision Rule (04:26 - 06:40): The core mechanic of comparing the p-value to your significance level. A Critical Clarification (06:40 - 07:58): The video explicitly addresses the most common misunderstanding of p-values.
As the video and the article below emphasize, it's crucial to avoid a common misconception: the p-value is NOT the probability that the null hypothesis is true. It's a measure of how consistent your data is with the null hypothesis.
The decision rule is straightforward:
- You pre-select a significance level (α), usually 0.05 (which corresponds to 95% confidence). This is your threshold for "surprise."
- If p-value < α, your result is statistically significant. You reject the null hypothesis and conclude there is evidence for a real effect.
- If p-value ≥ α, your result is not statistically significant. You fail to reject the null hypothesis, meaning you don't have enough evidence to claim there's a real effect.
The Confidence Interval: A Range of Plausible Outcomes
While a p-value gives you a yes/no on statistical significance, a confidence interval gives you a more intuitive sense of the magnitude and uncertainty of the effect.
A 95% confidence interval for your lift gives you a range of values that you can be 95% confident contains the true lift.
A Comprehensive Guide to Statistical Significance
The article 'A Comprehensive Guide to Statistical Significance' from Statsig has an excellent section that clearly explains both p-values and confidence intervals and how they work together.
Please read the sections titled 'Interpreting p-values and confidence intervals' and 'Common misconceptions about p-values.' Focus on how confidence intervals provide context (the range of likely values) that p-values alone do not, and reinforce your understanding of what a p-value is not.
Here’s how to interpret a confidence interval in practice:
- If the 95% CI is
[+2%, +8%]:- You are 95% confident the true lift is somewhere between 2% and 8%.
- Since the entire range is positive and does not include 0, the result is statistically significant at the 95% confidence level.
- If the 95% CI is
[-1%, +5%]:- The range of plausible outcomes includes a small negative effect (-1%), no effect (0%), and a positive effect (+5%).
- Since the range includes 0, the result is not statistically significant.
- The width of the interval indicates precision. A narrow interval like
[+4%, +5%]means you have a very precise estimate. A wide interval like[+1%, +15%]means there's still a lot of uncertainty about the true effect size.
Test your understanding!
Your team runs a test on a new ad creative. They report the following results for the click-through rate (CTR):
- Observed Lift: +10%
- P-value: 0.15
- 95% Confidence Interval:
[-2%, +22%]
How would you interpret these results? Is the new creative a clear winner?
Show answer
You would interpret the results as follows:
- The p-value (0.15) is greater than the standard 0.05 threshold. This means the result is not statistically significant. We cannot confidently reject the null hypothesis that there is no real difference in CTR.
- The 95% confidence interval
[-2%, +22%]confirms this. Because the interval contains 0, it's plausible that the true effect could be zero (or even slightly negative). - The new creative is not a clear winner. While the observed lift was +10%, the high p-value and wide confidence interval tell us we can't be sure this wasn't just due to random chance. The true effect could be as high as a 22% lift, but it could also be a 2% drop. There is too much uncertainty to declare a winner.
2. A Strategic Framework for Calling a Winner
Relying solely on a p-value is a common mistake. As a leader, you need a more robust mental model that blends statistical rigor with business pragmatism. Statistics are a tool, but they don't replace judgment.
This next video provides an excellent four-step framework that places statistical confidence in its proper context—as the final check, not the only one.
A/B Testing & Statistical Significance - 4 Steps to Know How to Call a Winning Test
The video 'A/B Testing & Statistical Significance - 4 Steps to Know How to Call a Winning Test' offers a practical, business-oriented approach that is perfect for a strategic leader.
Please watch from the beginning to 09:43. The video outlines four principles to check before declaring a winner. Notice how statistical confidence is the last piece of the puzzle. Sufficient Data: Did you collect enough data? Consistent Data: Does the trend look stable over time? Differentiated Data: Is the lift meaningful enough? Statistical Confidence: Do the p-value and confidence interval confirm the story?
Let's integrate this into your decision-making process:
- Check for Sufficient Data: Did the test run for its planned duration and reach the required sample size? (This links directly back to our previous lesson). If not, the results are premature and unreliable.
- Check for Consistent Data: Look at the day-by-day or hour-by-hour chart of performance. Is the winning variation consistently outperforming the control, or are the lines crossing back and forth? A stable, consistent trend builds confidence.
- Check for Differentiated Data: Is the observed lift practically significant? Does it clear your MDE? A 0.1% lift might be statistically significant with a huge sample size, but it's likely not worth the engineering cost to implement.
- Check for Statistical Confidence: After the first three checks are positive, now look at the p-value and confidence interval. They serve as the final confirmation that what you're seeing is a real effect and not just noise.
3. The "Ship/No-Ship" Decision Matrix
Now let's apply this framework to make the final call. The decision isn't always a simple yes or no. The business context matters immensely. An excellent article by Harlan Harris proposes different decision types based on the motivation for the test.
The Five Types of A/B Test Decisions
The article 'The Five Types of A/B Test Decisions' is a fantastic strategic guide. It moves beyond a one-size-fits-all rule and provides different frameworks for different business situations.
Please read the sections on the 'Superiority Decision' and the 'Bias-to-Ship Decision'. These two cover the most common scenarios you will face.
Let's structure our decision-making around these contexts.
| Scenario | Result Example | Interpretation & Decision |
|---|---|---|
| Clear Winner (Superiority) | Lift: +5% p-value: 0.01 95% CI: [+1.5%, +8.5%] |
Interpretation: The result is statistically significant, and the entire range of plausible effects is positive and meaningful. DECISION: Ship it. |
| Clear Loser | Lift: -4% p-value: 0.02 95% CI: [-7%, -1%] |
Interpretation: The result is statistically significant in the negative direction. The variation is proven to be harmful. DECISION: Do not ship. Learn from it. |
| Inconclusive (Flat) | Lift: +0.5% p-value: 0.60 95% CI: [-2%, +3%] |
Interpretation: No evidence of an effect. The confidence interval is centered around zero. It's likely a wash. DECISION: Do not ship. This is the most common outcome of A/B tests. |
| Inconclusive (Promising but Uncertain) | Lift: +8% p-value: 0.10 95% CI: [-1%, +17%] |
Interpretation: Not statistically significant, but the observed lift is large and the potential upside is high. The test may have been underpowered. DECISION: Do not ship yet. Consider iterating on the idea or re-running the test with a larger sample size if the potential business impact is huge. |
| "Do No Harm" (Bias-to-Ship) | Lift: +1% p-value: 0.45 95% CI: [-1.5%, +3.5%] |
Interpretation: The test is for a necessary backend refactor or re-brand. The goal was to ensure it didn't hurt performance. Since the CI shows no evidence of a significant negative impact, it meets the goal. DECISION: Ship it. |
4. Communicating Your Decision
Your final task as a leader is to communicate the results and your decision clearly. Avoid statistical jargon. Frame the outcome in terms of business impact and confidence.
A Comprehensive Guide to Statistical Significance
The Statsig guide we looked at earlier has a great section on communication. Let's revisit it to focus on best practices for reporting.
Please read the final section, 'Best practices for reporting statistical significance'. Pay special attention to the advice on communicating with non-technical audiences and framing results in terms of business impact.
Here are some phrases to adopt:
-
Instead of: "The p-value was 0.03, so we reject the null hypothesis."
-
Say: "The results show with 97% confidence that the new version is better."
-
Instead of: "The lift was 4%."
-
Say: "We saw a 4% lift in conversions. Based on the data, we're 95% confident the true impact of this change is between a 2% and 6% lift, which translates to an estimated $X in additional revenue per quarter."
This approach communicates the result, the level of certainty, the range of plausible outcomes, and the business impact, giving your stakeholders everything they need to know.
Conclusion
You are now prepared to move from experiment data to business decisions. You understand how to use p-values and confidence intervals not as rigid rules, but as powerful inputs into a broader strategic framework.
Key Takeaways:
- A p-value tells you how surprising your result is, while a confidence interval gives you a plausible range for the true effect.
- Always use the four-step check: ensure you have sufficient, consistent, and differentiated data before you confirm with statistical confidence.
- The "ship/no-ship" decision depends on the business context. Are you looking for a clear superiority win, or just ensuring you do no harm?
- Communicate results in plain business language, focusing on impact and the degree of certainty, not on statistical jargon.
Preview of the Next Lesson:
We've now covered how to design, size, and interpret an A/B test. But even with a perfectly interpreted result, things can go wrong. In our next lesson, we will "Identify and mitigate common experimentation pitfalls (e.g., peeking, multiple testing, regression to the mean)," to ensure the integrity of your entire testing program.