
Hello! Welcome to your next lesson in the "Designing and Interpreting Experiments" module.
In our last lesson, we focused on how to interpret the results of a valid A/B test. You learned to use p-values and confidence intervals within a strategic framework to make a confident "ship/no-ship" decision.
Today, we address a critical follow-up question: what can make a test invalid? An experiment can have a low p-value and a promising lift, but if it falls prey to common procedural errors, the results can be misleading and lead to costly business mistakes. Your role as a leader is to safeguard the integrity of your team's experimentation process by spotting and mitigating these issues.
This lesson is designed to help you identify and mitigate common experimentation pitfalls, including peeking, multiple testing, and regression to the mean. We'll explore why these issues occur and, most importantly, what you can do to ensure your decisions are based on trustworthy data.
1. The Peeking Problem: Resisting the Urge for Early Answers
Imagine you've launched an exciting test for a new checkout flow. You're eager to see the results, so you check the dashboard every hour. After a few hours, the new version shows a statistically significant lift! The temptation is to stop the test, declare victory, and have the team ship the change immediately. This is known as peeking.
Why it's a problem: Continuously monitoring a test and stopping it the moment it crosses the significance threshold dramatically increases your chance of a false positive (a Type I error).
Think of it this way: conversion rates naturally fluctuate. If you watch long enough, random noise will almost certainly make one variation look temporarily "significant." Stopping the test at that exact moment means you're acting on chance, not on a real effect.
To understand this in a practical context, let's watch a short segment from data scientist Emma Ding.
A/B Testing Mistakes to Avoid in Your Data Science Interview: Tips and Tricks!
In this clip from 'A/B Testing Mistakes to Avoid,' Emma Ding explains the peeking problem with a very relatable scenario involving a product manager.
Please watch from 01:41 to 03:38. Pay close attention to her explanation of why this makes the result unreliable and not reproducible.
As the video highlighted, an effect captured by peeking is often not reproducible when you roll it out to 100% of your users. So, how much does peeking inflate your risk?
Ten common A/B testing pitfalls and how to avoid them
This document from Adobe Target, 'Ten common A/B testing pitfalls and how to avoid them,' quantifies the danger of peeking.
Please read the section titled 'Pitfall 5: Monitoring tests.' Focus on the example given: just by looking at the test 10 times, the false positive rate can jump from 5% to 16%!
Mitigation Strategies for Leaders:
- Enforce Discipline: The most effective solution is procedural. Insist that every test has a pre-calculated sample size and duration (as we discussed in our lesson on MDE and power). The test runs for that full duration, period.
- Frame Mid-Test Checks Appropriately: It's okay to check a test's dashboard to ensure it's running correctly (e.g., traffic is being allocated, events are firing). However, you must foster a culture where these checks are for technical health, not for early decision-making.
- Ask the Right Question: Instead of "Is it winning yet?", ask "Has the test reached the pre-determined sample size?"
2. The Multiple Testing Problem: Finding Fool's Gold
Let's say you run an A/B test on a landing page. You don't just measure the primary goal (e.g., sign-ups); you also track 19 other metrics: clicks on the logo, time on page, scroll depth, etc. At the end of the test, you find that one metric—clicks on the privacy policy link—is statistically significant with a p-value of 0.04. Should you get excited?
Probably not. This is a classic example of the multiple testing problem. When you test many things at once, the probability of finding at least one "significant" result purely by chance increases dramatically. If you use a 95% confidence level (meaning a 5% chance of a false positive), and you test 20 independent metrics, you're highly likely to find at least one false positive.
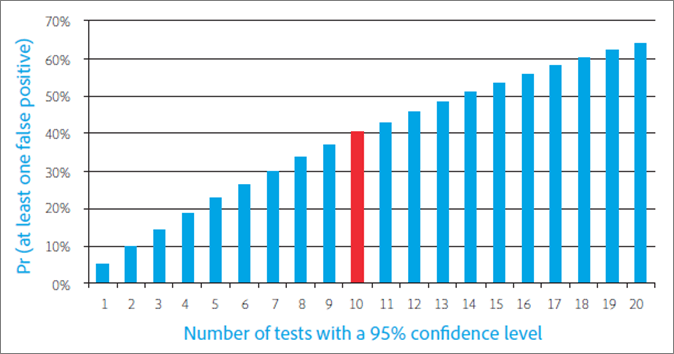
The multiple testing problem can sneak in in several ways:
- Testing multiple metrics in a single experiment.
- Testing multiple variations against a control (A/B/C/D...).
- Slicing your results into many segments after the test (e.g., by device, country, new vs. returning users).
A/B Testing Mistakes to Avoid in Your Data Science Interview: Tips and Tricks!
Let's return to Emma Ding's video, where she clearly breaks down the scenarios where multiple testing occurs and offers a practical way to handle it.
Please watch from 03:38 to 08:38. Focus on: The different ways multiple testing can happen (04:30). The two-step rule of thumb for managing multiple metrics by categorizing them before the test (06:23). This is a great strategic tool.
Mitigation Strategies for Leaders:
- Declare Primary Metrics Upfront: Before launching a test, your team must define a single primary metric that determines success. You can also have a few secondary or guardrail metrics (e.g., you want to increase sign-ups without hurting revenue per user), but the ship/no-ship decision should be based on the primary metric.
- Treat Segment Discoveries as New Hypotheses: If you discover a significant lift in a specific segment (e.g., "our new headline works great for mobile users in Canada"), don't treat it as a conclusive fact. Treat it as a promising new hypothesis that warrants its own follow-up A/B test targeted at that specific segment.
- Be Aware of Statistical Corrections: Your analytics team might mention using methods like the Bonferroni correction or FDR (False Discovery Rate) control. You don't need to know the math, but you should understand their purpose: they adjust the significance threshold to control for the inflated false positive risk from multiple testing. The Bonferroni correction, as mentioned in the Adobe article LINK, is a very simple but strict method.
Test your understanding!
Your team runs a test for a new homepage design. The primary metric, conversion to trial, shows no significant lift. However, a junior analyst excitedly reports that after segmenting the data by 25 different countries, they found a statistically significant lift for users in Belgium (p = 0.03). What should be your response?
Show answer
Your response should be one of cautious optimism and procedural guidance:
- Acknowledge the finding but immediately introduce skepticism: "That's an interesting finding, but since we looked at 25 different countries, we have to be very careful about the multiple testing problem. It's quite likely this could be a false positive."
- State the correct next step: "The primary metric for this test was flat, so we won't be shipping the new design for everyone. However, this finding about Belgium is a great new hypothesis."
- Propose a follow-up action: "Let's add an idea to our backlog to design and run a new experiment specifically targeted at users in Belgium to see if we can replicate this result. We can't act on this finding alone."
This response validates the analyst's work while enforcing the correct experimental procedure and preventing the company from making a decision based on a likely statistical fluke.
3. Regression to the Mean: Don't Trust the Hot Streak
You launch a test, and in the first two days, the variation is outperforming the control by a staggering 50%! It's the biggest win you've seen all year. But over the next two weeks, that lift slowly shrinks and eventually settles at a modest but stable 4%.
What happened? You've just witnessed regression to the mean. This is the statistical phenomenon where an extreme outcome is likely to be followed by a less extreme one.
Performance in an A/B test is a combination of the true underlying effect and random luck. An exceptionally high initial result usually means you had a lot of good luck on your side. Over time, as more data comes in, that luck evens out, and the observed lift "regresses" toward its true, long-term average.
The following video provides one of the best explanations of this concept.
How We’re Fooled By Statistics
The video 'How We’re Fooled By Statistics' from Veritasium uses fantastic real-world examples to explain regression to the mean and how it tricks us into seeing causality where there is none.
Please watch these key segments: The Fighter Pilot Anecdote (00:01 - 02:04): A classic story of misattributed causality. The Core Concept (02:04 - 02:55): A simple, clear example using a random test. Application to Experiments (03:57 - 05:48): Directly relates the concept to drug trials and other interventions. Conclusion on Feedback (05:48 - 06:54): Brings the pilot story full circle. Focus on how this phenomenon can lead us to make incorrect conclusions about the effectiveness of our actions.
Why it's a problem for leaders:
- Premature celebration/panic: Overreacting to initial extreme results (both positive and negative) leads to emotional whiplash and poor decision-making.
- Misallocating resources: A team might abandon a truly good idea because it had an unlucky, poor start, or conversely, go all-in on an idea that had a lucky, unsustainable start.
Mitigation Strategies:
- Patience is a virtue: This is another strong argument for running tests for their full, pre-determined duration. Allow time for performance to stabilize.
- Look at trend lines, not just snapshots: In your results dashboard, view the chart showing the conversion rates over time. You want to see the variation's performance line separate from the control's and then run parallel to it. This indicates a stable, real effect, not just an early spike.
Conclusion: Fostering a Culture of Rigor
As a marketing leader, you are the chief defender of your organization's decision quality. Understanding these common pitfalls—peeking, multiple testing, and regression to the mean—is not about becoming a statistician. It's about knowing which critical questions to ask to ensure your team's hard work produces reliable insights, not random noise.
Key Takeaways:
- Don't Peek: Enforce the discipline of running tests to their pre-calculated sample size to avoid acting on random fluctuations.
- Beware of Multiple Comparisons: Always have a primary metric. Treat surprising findings in secondary metrics or segments as new hypotheses to be tested, not as immediate wins.
- Expect Regression to the Mean: Don't get carried away by initial extreme results. Wait for performance to stabilize to understand the true, long-term effect.
- Your role is to foster a culture of patience and statistical rigor, turning your experimentation program into a reliable engine for growth.
Preview of the Next Lesson:
We now have a solid foundation for designing, running, and interpreting valid A/B tests. But running tests costs time and resources. This raises a fundamental strategic question: how do you balance testing new, unproven ideas against scaling the things you already know work? In our next lesson, we will evaluate the strategic trade-offs between exploration (testing) and exploitation (scaling winners).