
Hello! Welcome back to our introduction to Power BI.
In our previous lesson, we took a guided tour of the Power BI Desktop interface. We familiarized ourselves with the Ribbon, the different Views, the main Canvas, and the crucial side Panes for Fields, Visualizations, and Filters. You learned that the Fields pane is where our data will live, but so far, it's been empty.
Today, we're going to change that. Our goal is to connect to and import financial data from Excel and other sources into Power BI. This is the foundational step for any analysis. Before you can create compelling visualizations, you need to bring your raw data into the tool. We will focus on the most common data sources you'll encounter in financial analysis: Excel workbooks, text/CSV files, and data from the web.
1. The "Get Data" Philosophy of Power BI
Power BI is designed to be a central hub for data from many different places. Unlike Excel, which primarily works with data contained within a single file, Power BI excels at connecting to and consolidating various data sources.
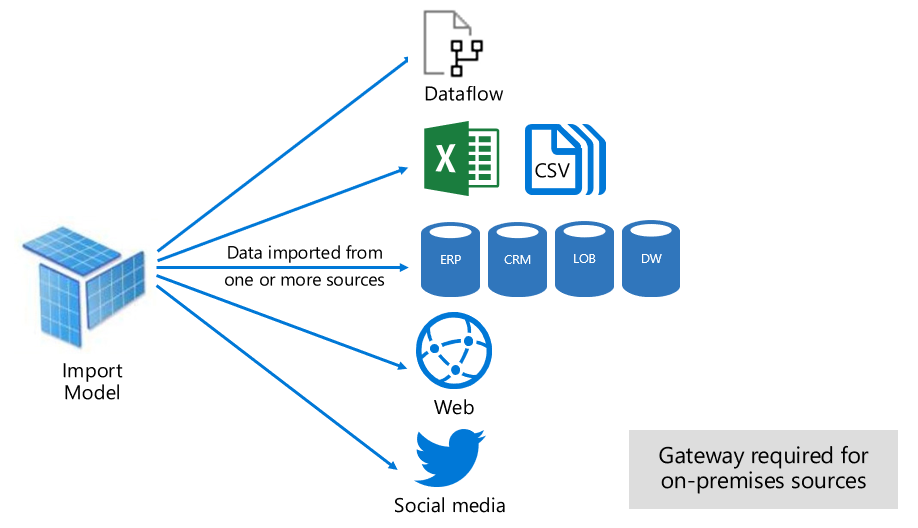
The starting point for this process is always the Get Data button, which you'll find prominently on the Home ribbon.
2. Connecting to Excel: Your Primary Workflow
Since we've already worked with financial data in Excel, connecting Power BI to your existing workbooks is the most logical and important first step. This will allow you to leverage the data preparation you did in Excel and take your visualizations to the next level in Power BI.
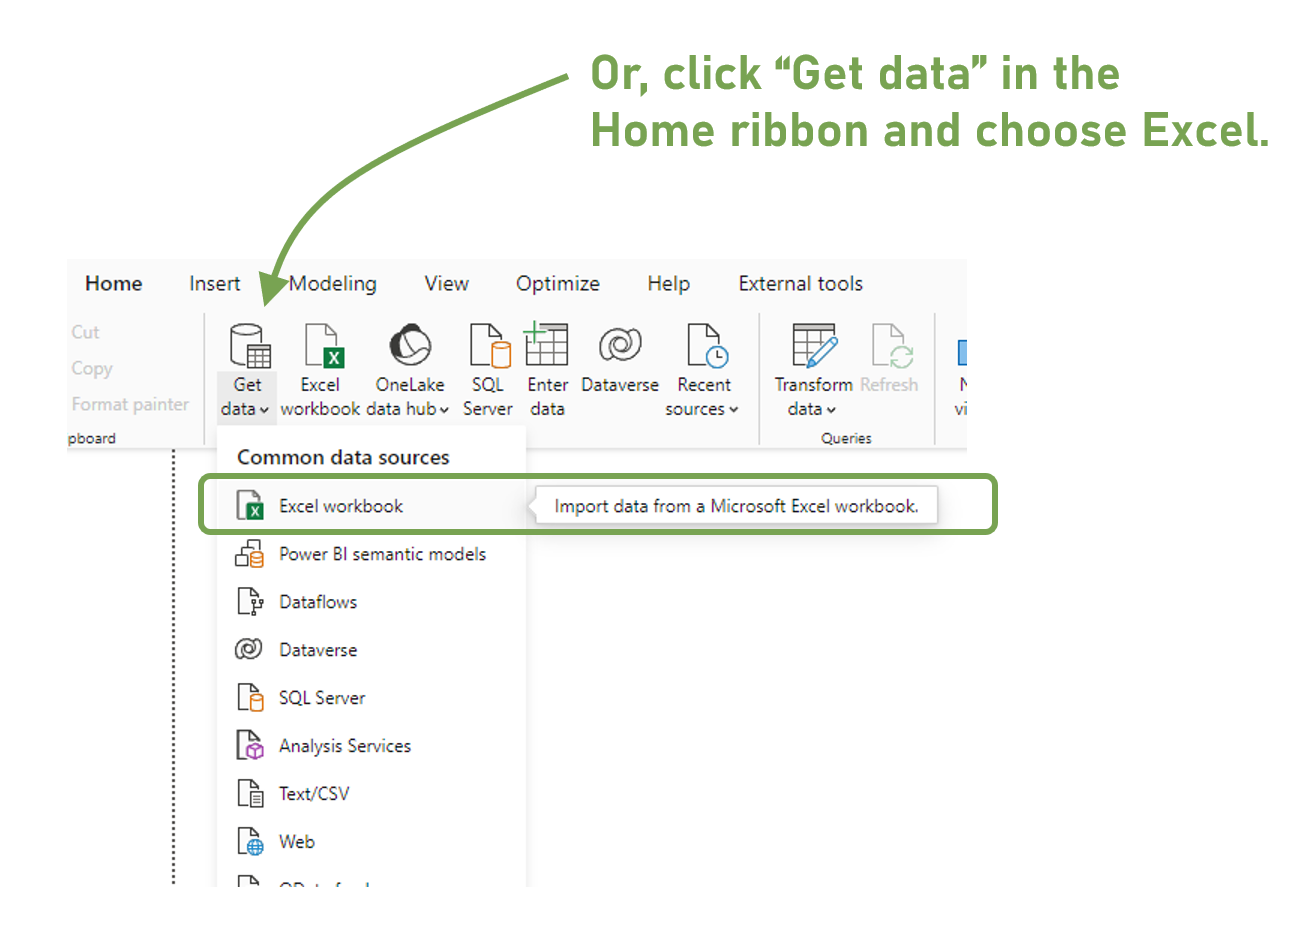
Let's do this with a hands-on exercise using a sample financial dataset from Microsoft.
From Excel Workbook to Stunning Report in Power BI
This official Microsoft guide will walk you through downloading a sample financial Excel file and importing it into Power BI. Please follow the initial steps closely.
Follow the instructions in the 'Download the sample' subsection to get the 'Financial Sample Excel workbook'. Then, in Power BI Desktop, use the 'Excel workbook' option to open this file. You can stop when you get to the 'Navigator' screen, which we will discuss next.
The Navigator Window
After you connect to an Excel file, Power BI shows you the Navigator window. Here, you can see all the tables and sheets within the workbook and preview their contents. You'll then have two main choices for each table you select:
- Load: This option loads the data directly into your Power BI model as-is. It's quick and works well if your data is already perfectly clean and structured.
- Transform Data: This option opens the Power Query Editor. This is an incredibly powerful tool that allows you to clean, shape, and prepare your data before it gets loaded. We will explore this in detail in our next lesson.
For now, watch this short video to see the Excel import process in action, including the Navigator step.
Your first 10 minutes of Power BI - A no-nonsense getting started tutorial for beginners
This clip from Chandoo provides a quick, clear demonstration of connecting to an Excel file and using the Navigator.
Watch from 01:31 to 02:12. Pay attention to how he selects the 'data' tab in the Navigator and mentions the option to either 'Load' or 'Transform Data'.
To reinforce this, the article below provides a great text summary of the import process and the choice between loading and transforming.
Power BI Tutorial for Beginners
This DataCamp tutorial provides a clear written explanation of the import process we just saw.
Please read the subsection titled 'Importing data'. It explains the preview window (Navigator) and why it's often better to import 'tables' rather than 'sheets' if they are available.
3. Expanding Your Horizons: Other Common Data Sources
While Excel is essential, much of the financial data you'll want to analyze comes from other sources. Historical stock prices are often downloaded as CSV files, and real-time data might be available in tables on websites. Power BI can handle these with ease.
This next video provides an excellent tour of connecting to multiple data types. We will watch it in segments.
How To Connect Data Sources In Power BI? | Power BI Tutorial For Beginners | Power BI | Simplilearn
This comprehensive video from Simplilearn demonstrates how to connect to various data sources. We'll start with one of the most powerful features: connecting to data on the web.
Watch from 01:12 to 05:44. This section shows how to import data from a published Google Sheet. The key takeaway here is the concept of a 'live' connection—when the data on the web updates, you can simply refresh your Power BI report to see the changes. This is incredibly useful for tracking market data.
Next, let's look at importing from simple text files, specifically Comma-Separated Values (CSV) files. This is one of the most common formats for exchanging financial data.
How To Connect Data Sources In Power BI? | Power BI Tutorial For Beginners | Power BI | Simplilearn
Now, let's continue with the same video to see how to import from Text/CSV and get a quick recap on Excel.
Watch from 05:44 to 09:10. This part demonstrates importing data from both a .txt file and a .csv file. Notice how Power BI automatically detects the delimiter (the character separating the columns, like a tab or a comma).
Test your understanding!
You are building a report and need to import data from two different places:
- A list of S&P 500 companies and their sectors, which you downloaded from a financial data provider as a
.csvfile. - A table showing current foreign exchange rates, which is published on a financial news website.
Which Get Data option would you use for each?
Show answer
- For the
.csvfile, you would use the Text/CSV connector. - For the table on the website, you would use the Web connector and provide the URL of the page.
4. The Universe of Data Connectors
We have focused on the most common file types, but Power BI's capabilities extend far beyond them. It can connect to enterprise databases (like SQL Server), cloud services (like Azure), online platforms (like Salesforce), and even pull data from tables within PDF documents.
You don't need to learn all of these, but it's valuable to know what's possible.
How To Connect Data Sources In Power BI? | Power BI Tutorial For Beginners | Power BI | Simplilearn
Let's watch one final clip from the Simplilearn video that provides an overview of the vast library of data connectors available in Power BI.
Watch from 14:34 to 18:08. Just absorb the variety. The key takeaway is that no matter where your financial data might be stored, there is a good chance Power BI has a way to connect to it.
Conclusion
Excellent work! You've successfully navigated one of the most critical first steps in Power BI: getting your data into the application. The once-empty Fields pane can now be populated with data from a variety of sources, ready for analysis.
Key Takeaways:
- The Get Data button on the Home ribbon is the starting point for all data import operations.
- Power BI has specific, optimized connectors for different data sources, including Excel workbooks, Text/CSV files, and Web pages.
- The Navigator window appears after you select a source, allowing you to preview and select the specific tables or sheets you want to import.
- You always have a choice to either Load the data directly or Transform Data first to clean and prepare it.
In this lesson, we focused on connecting to data and briefly saw the "Transform Data" button. This button is the gateway to the Power Query Editor. In our next lesson, we will dive headfirst into the Power Query Editor to perform basic data transformation and cleaning tasks. This is where we'll handle issues like incorrect data types, extra rows, and other common data quality problems to ensure our data is perfect for visualization.
Can't find a good explanation? Sign up and we'll make it for you
Sign up